National Wildlife Refuge species assessment
November 24, 2020

Ethan Plunkett, Brad Compton, Bill Deluca, Scott Jackson
Designing Sustainable Landscapes
A project of the Landscape Ecology Lab
Department of Environmental Conservation
University of Massachusetts Amherst
With support from U.S. Fish and Wildlife Service, North Atlantic-Appalachian Region
Silvio O. Conte National Fish And Wildlife Refuge - Fort River Division

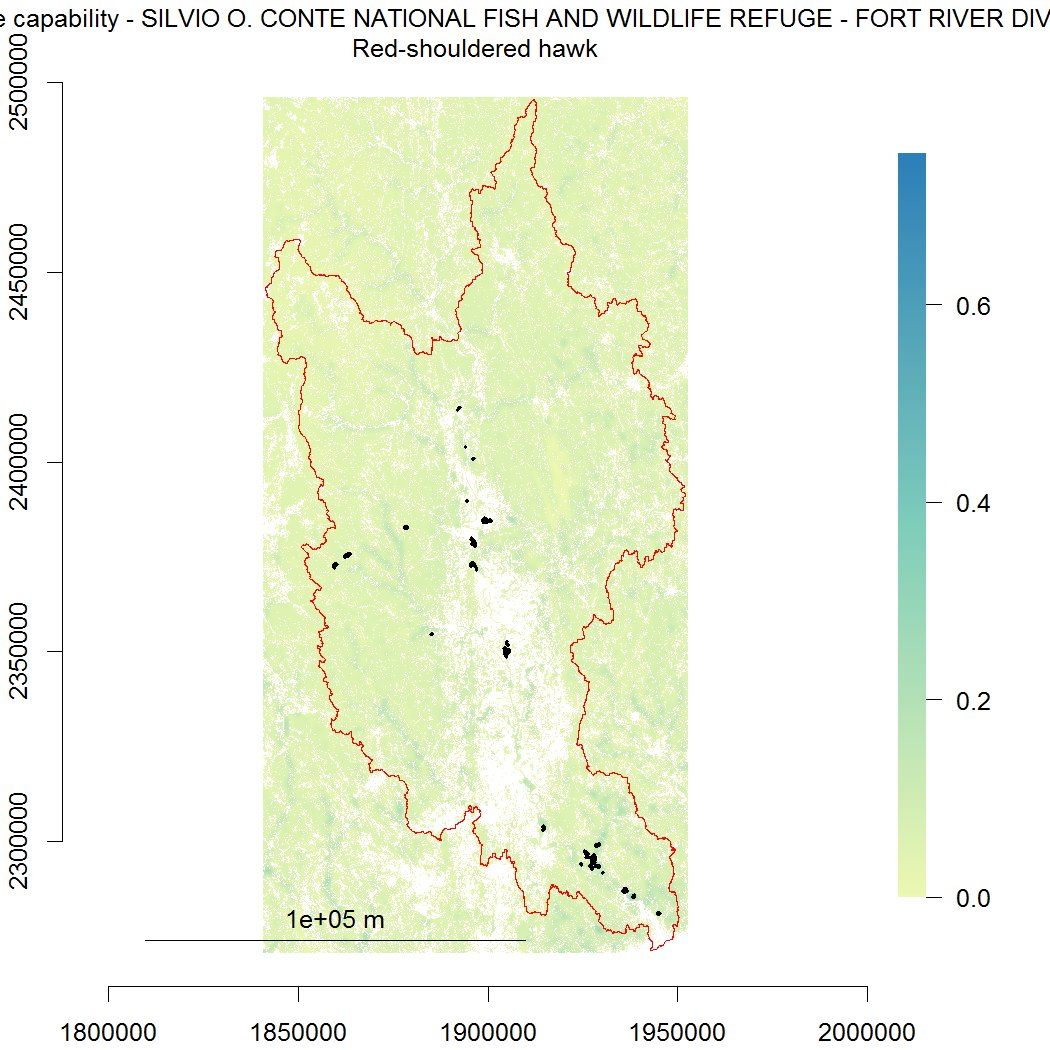
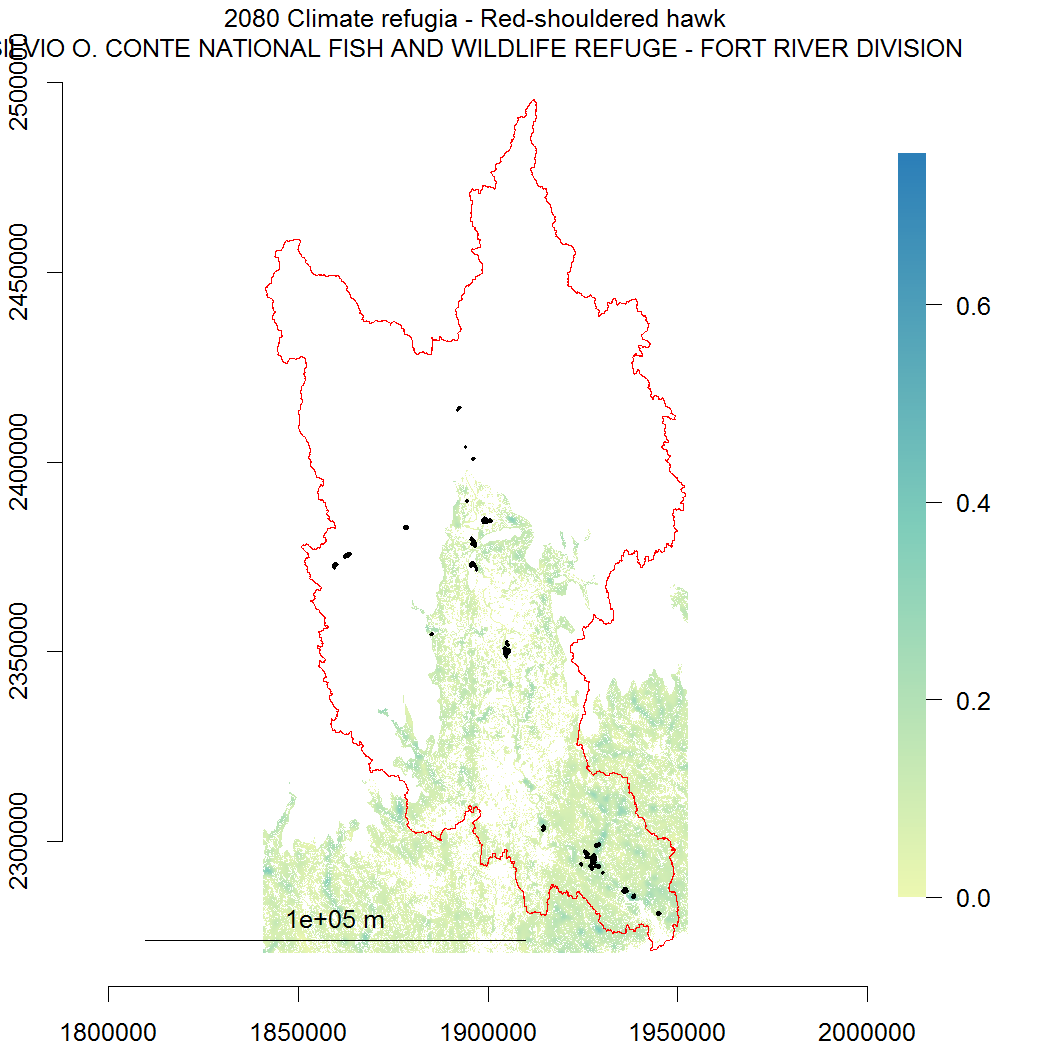
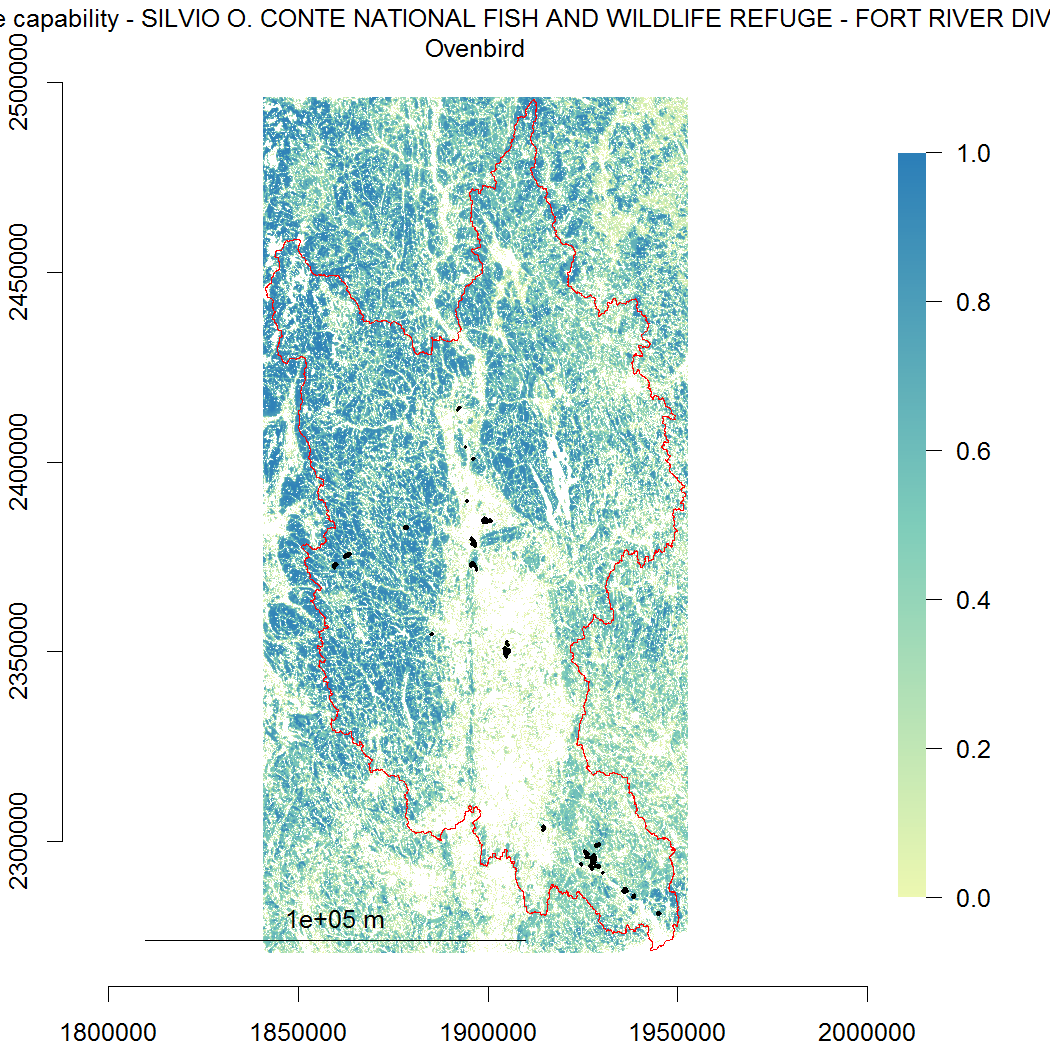
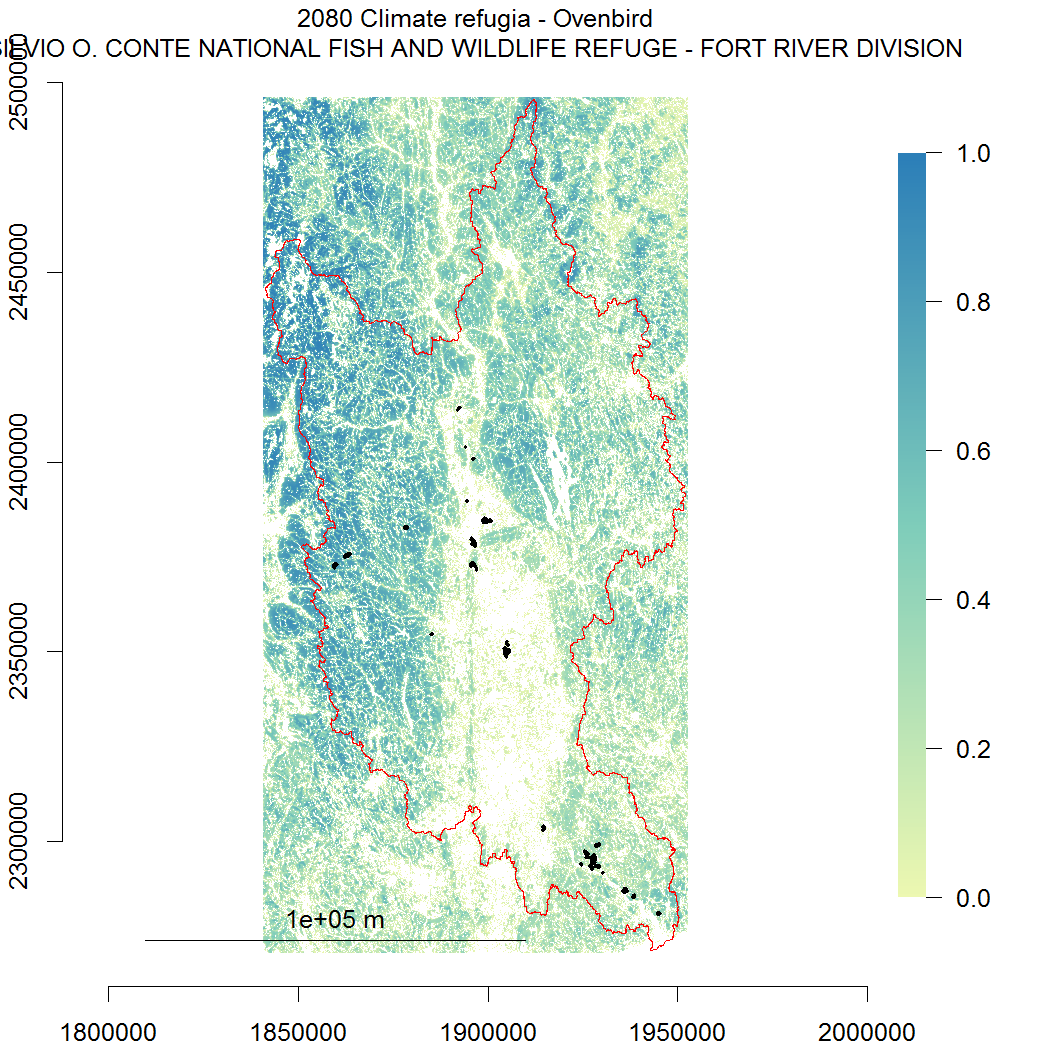
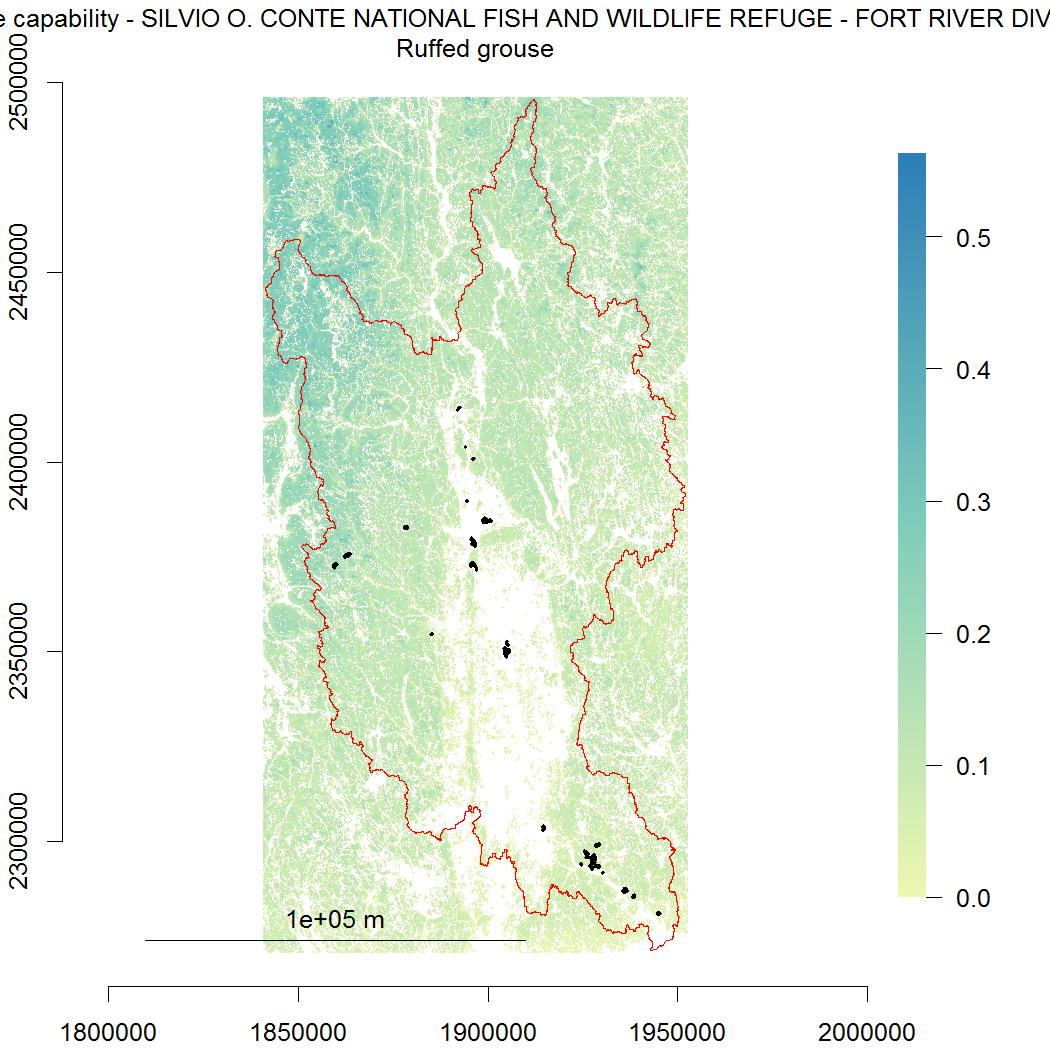
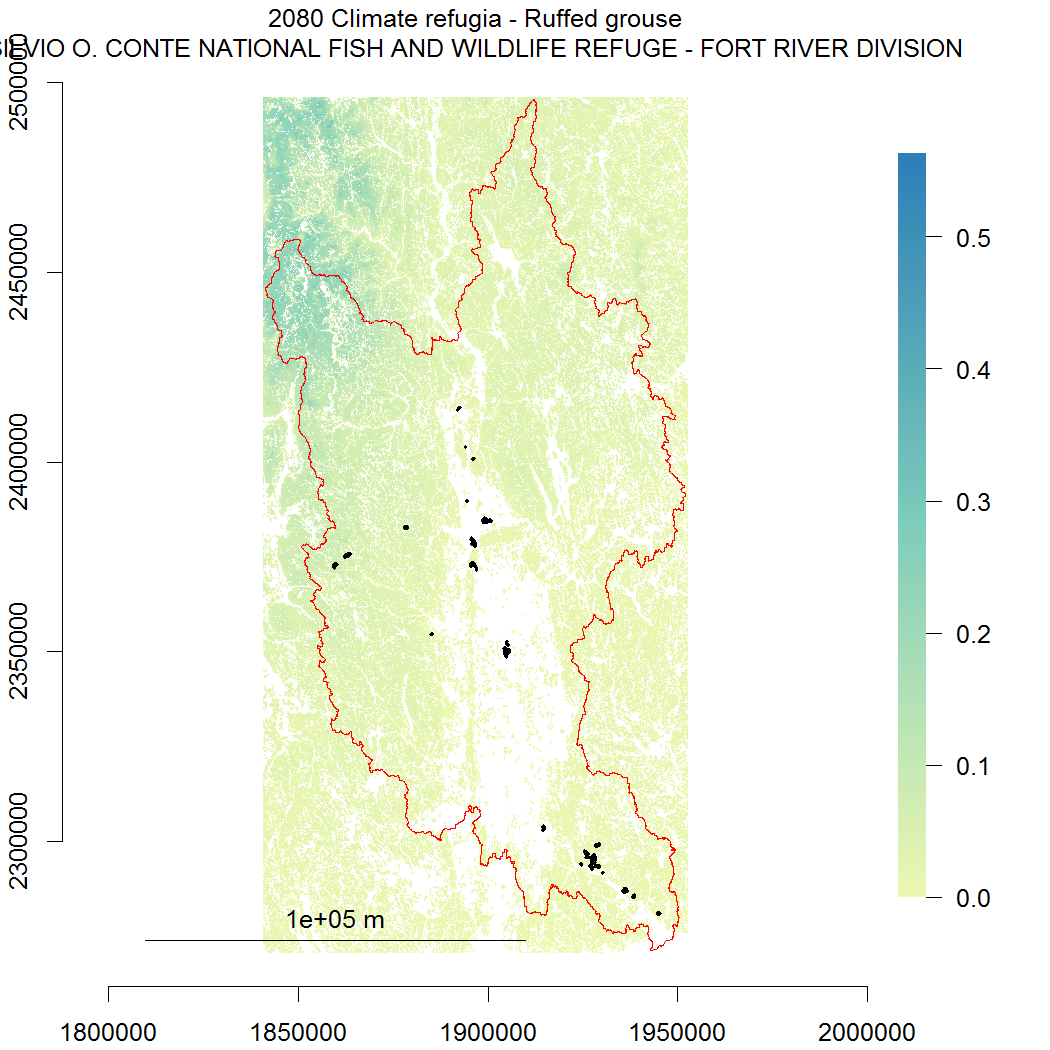
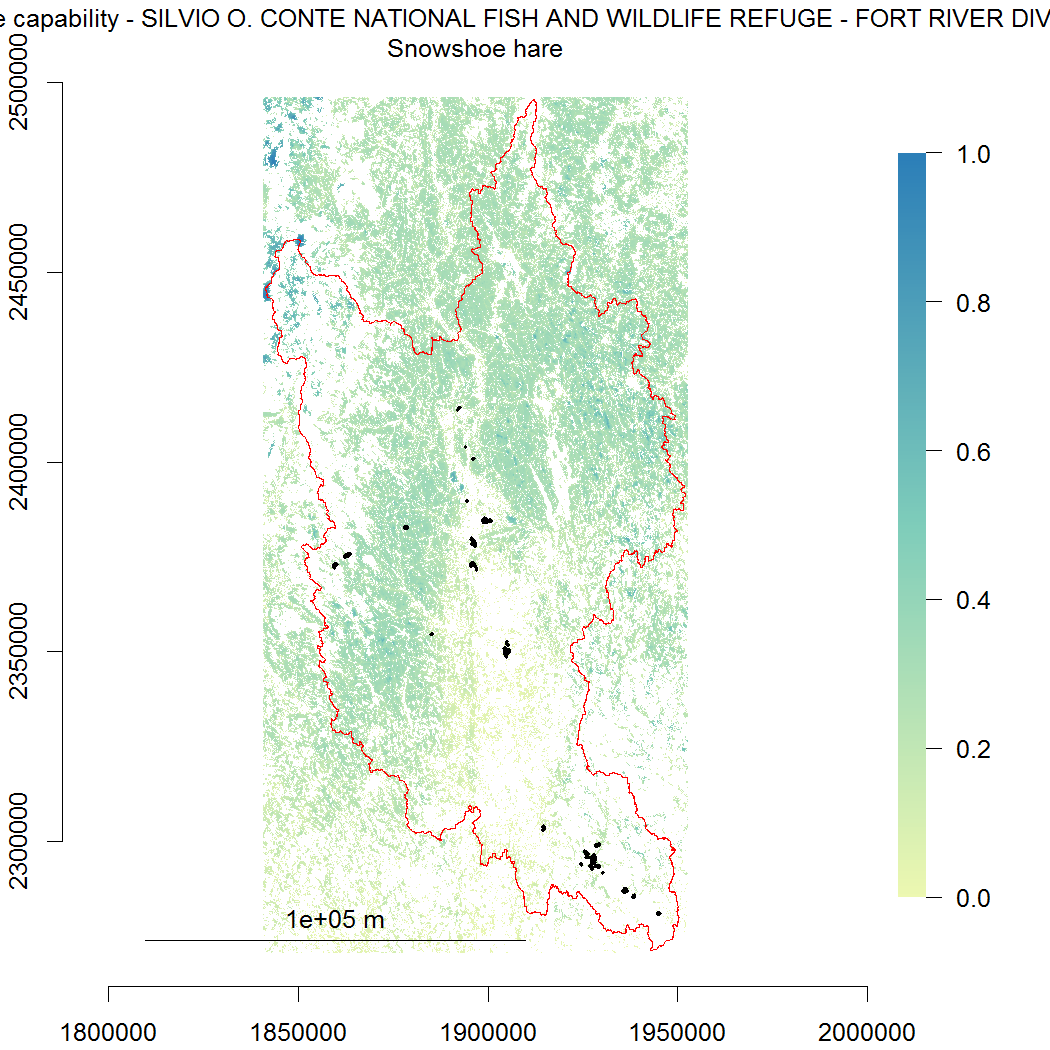
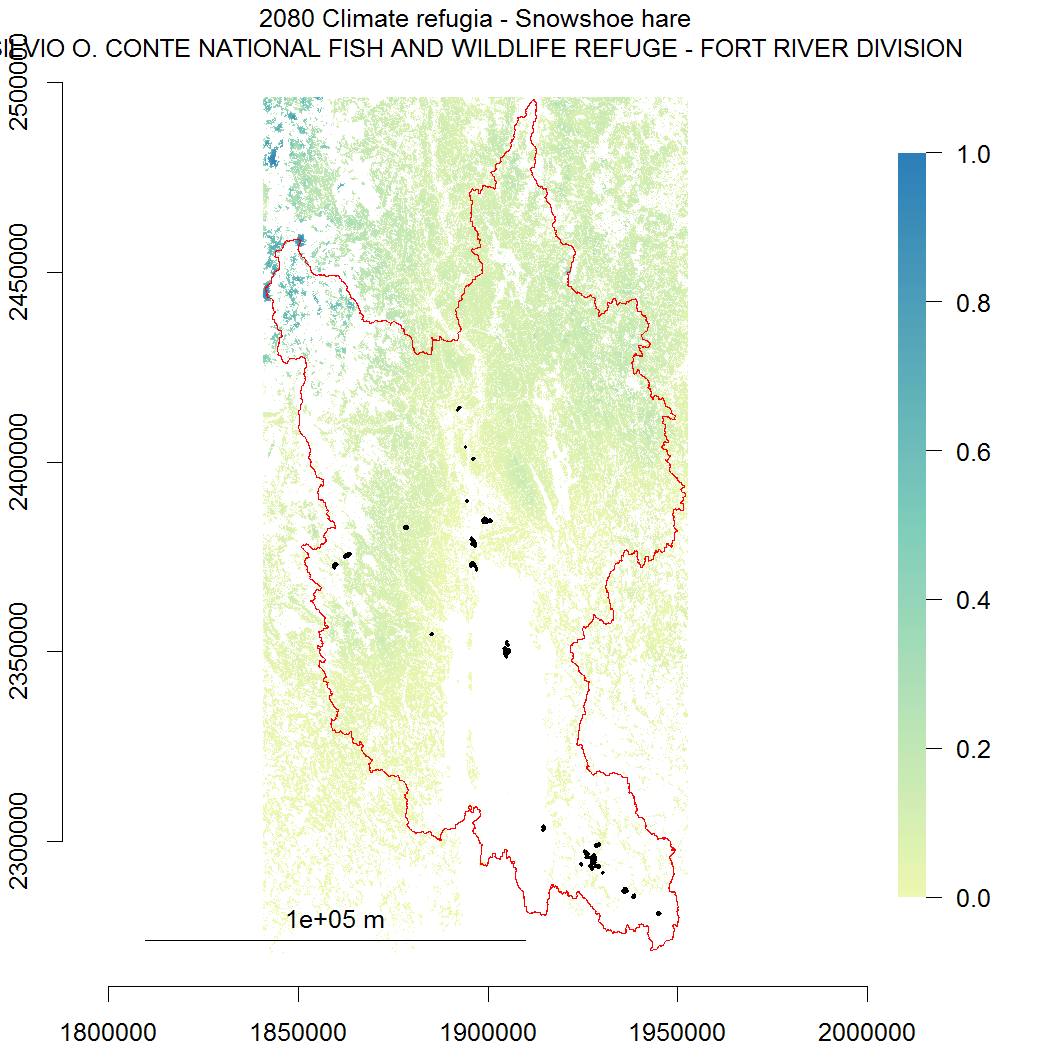
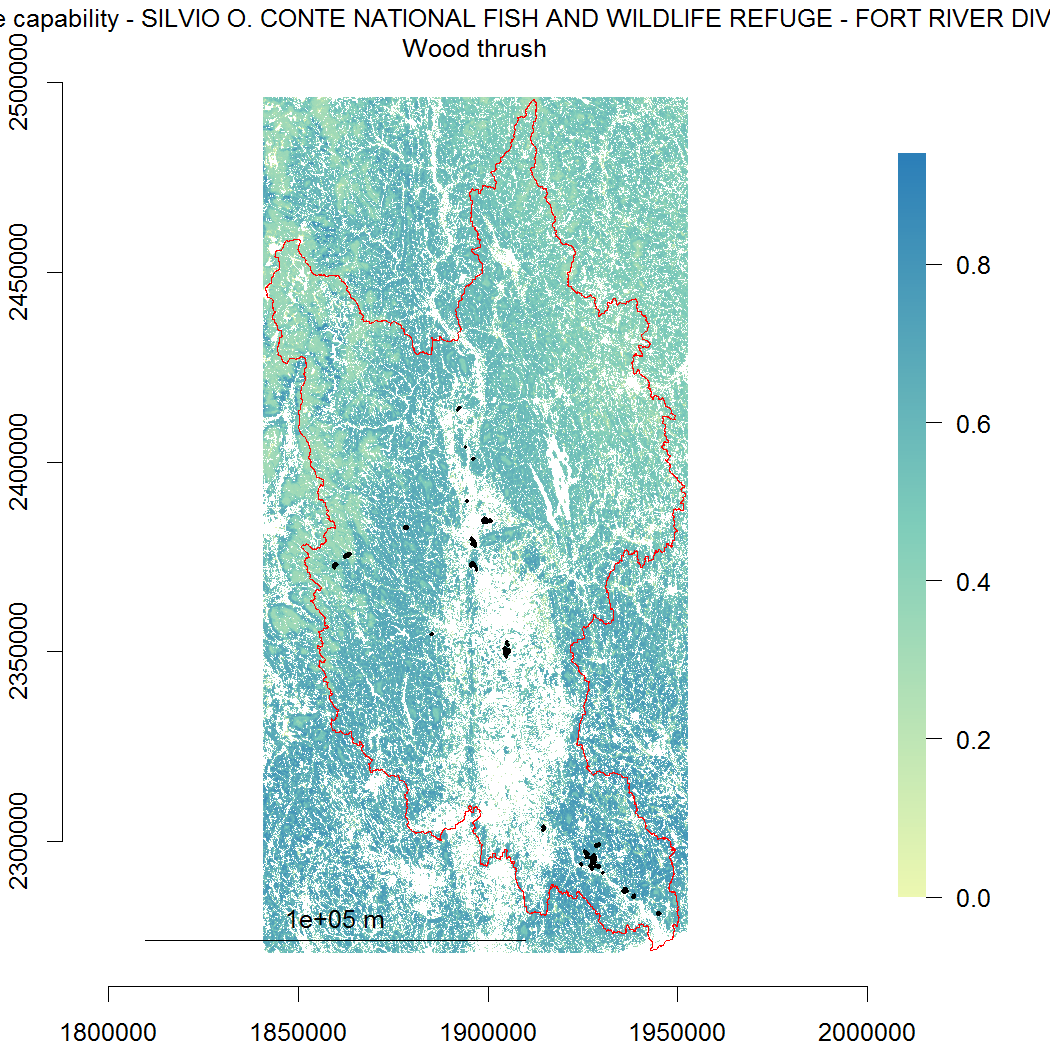
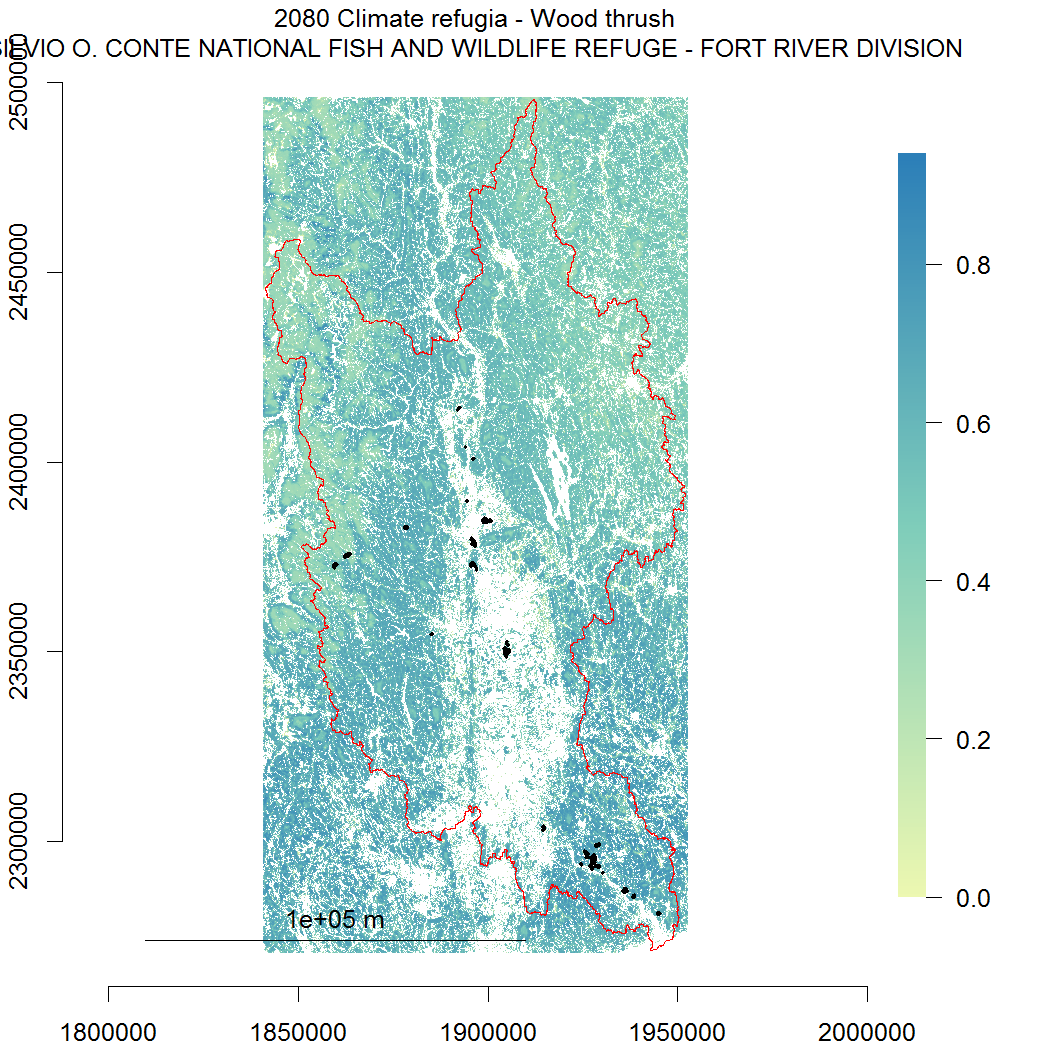
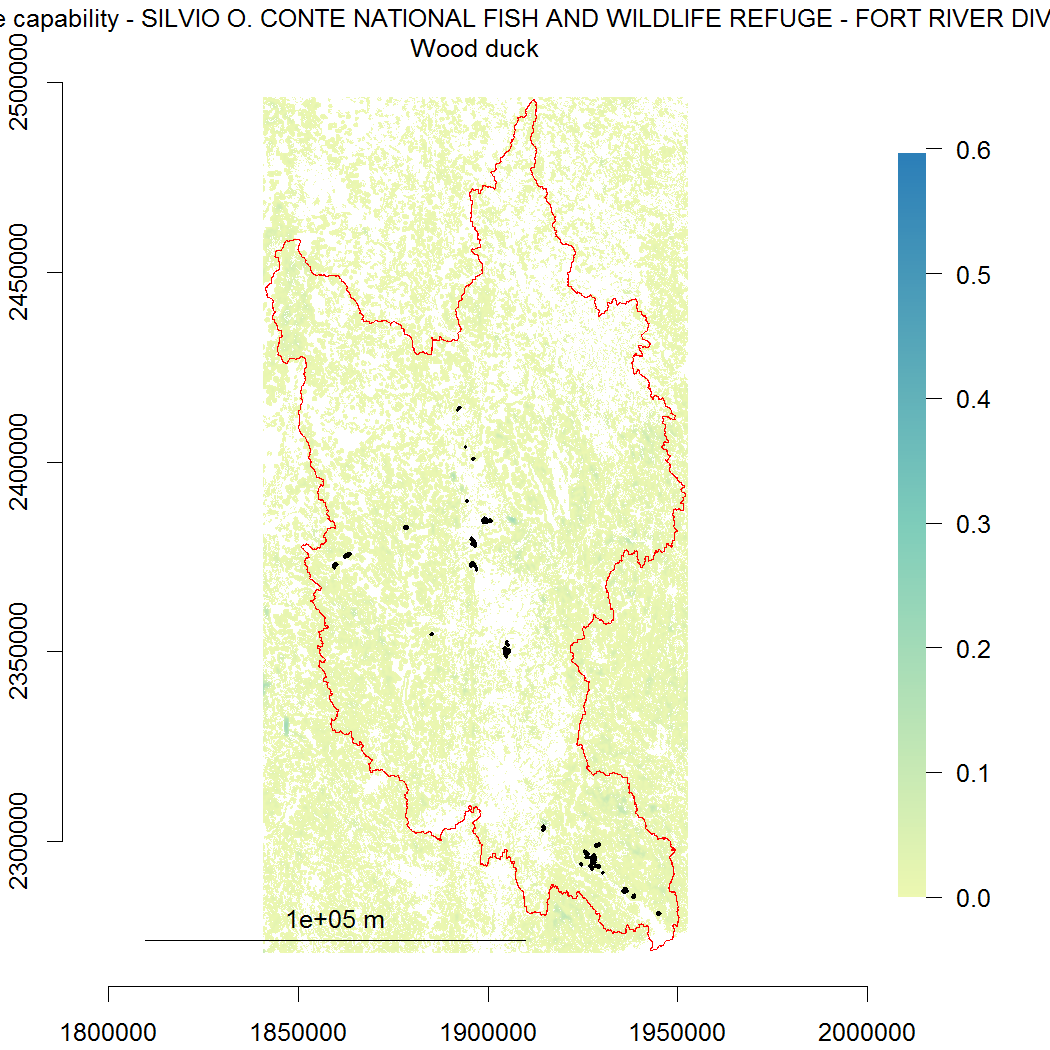
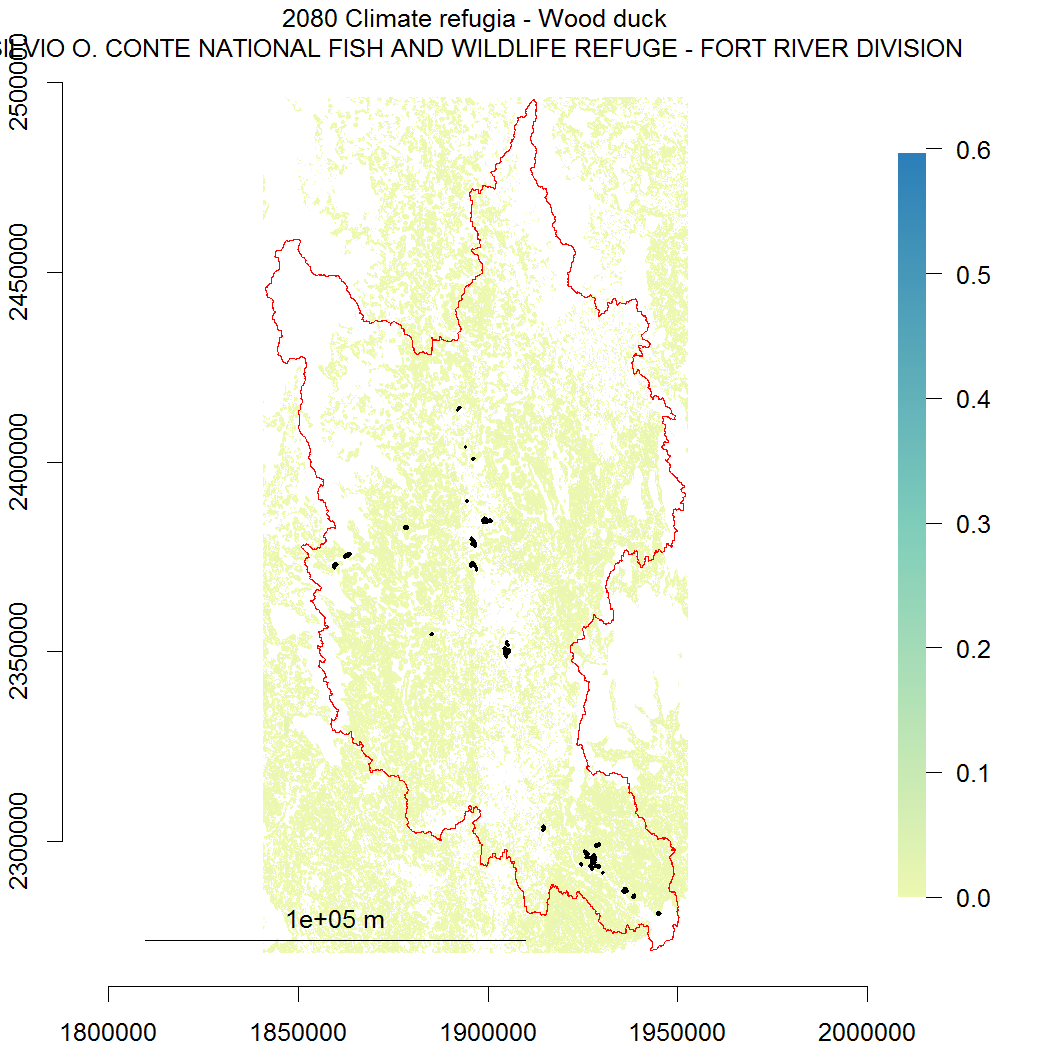
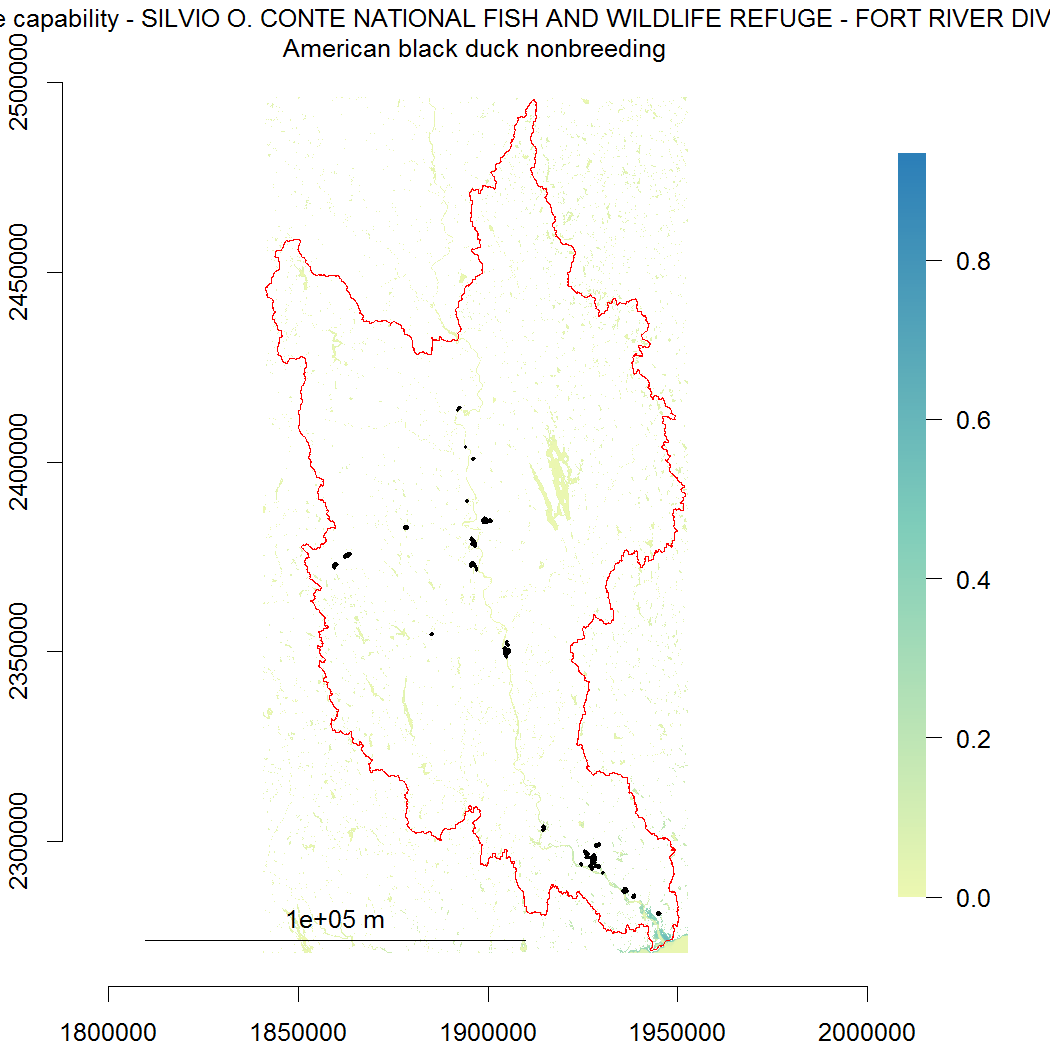
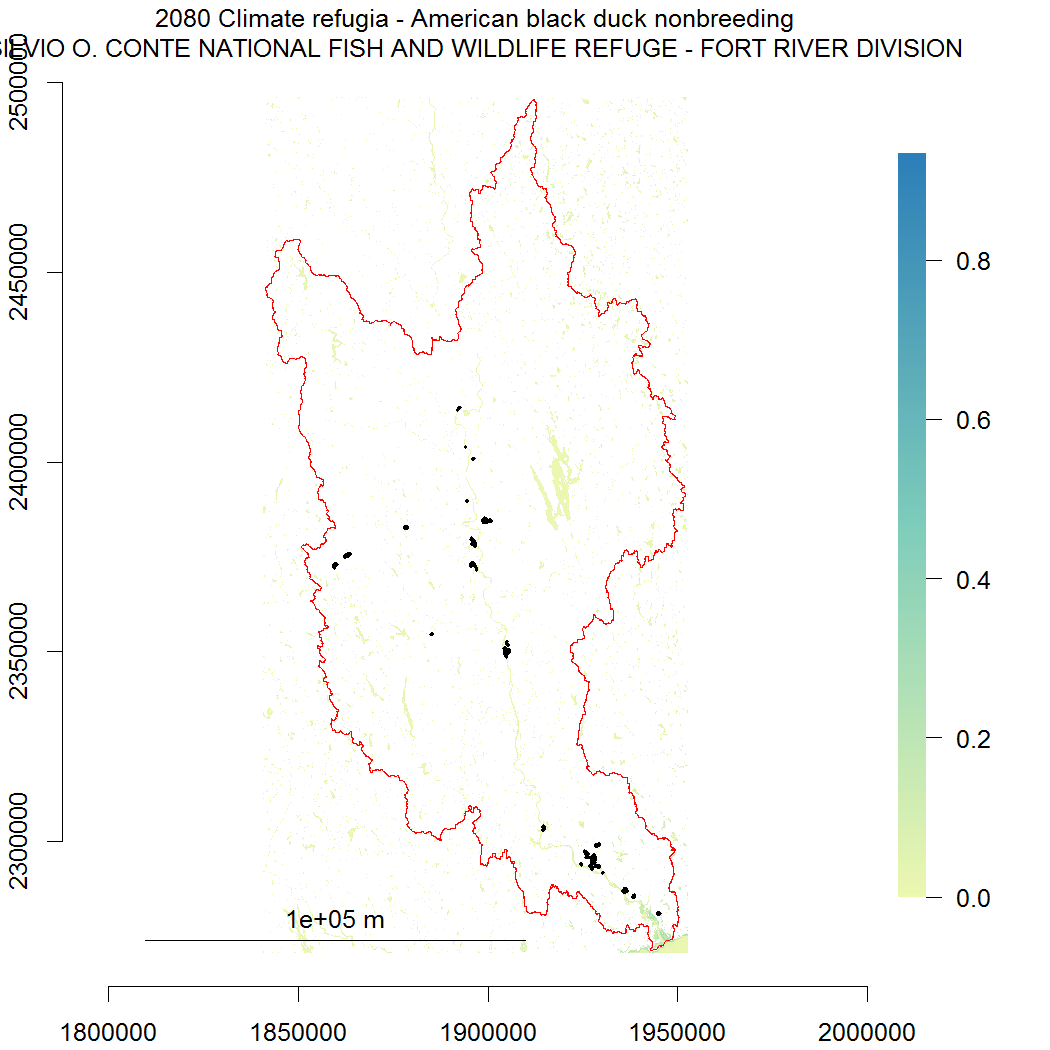
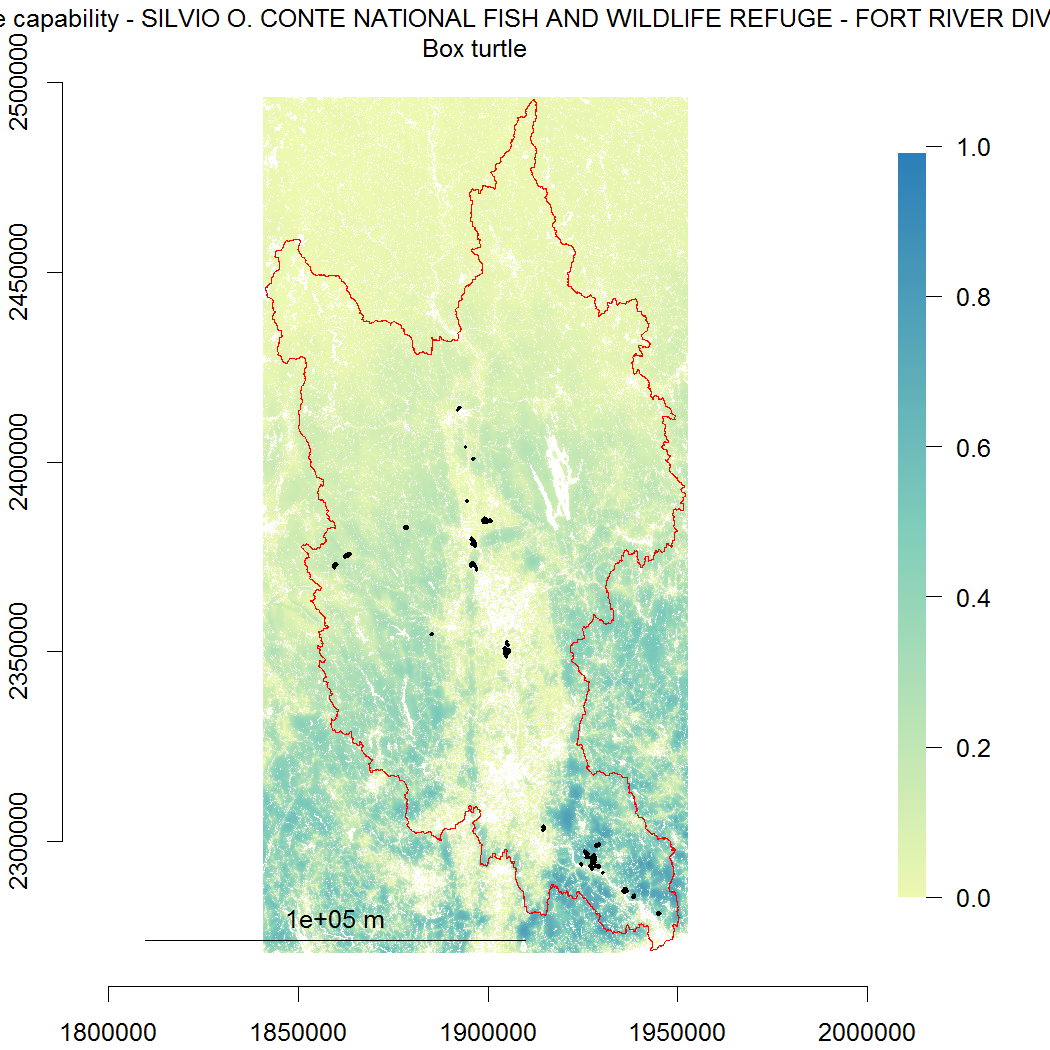
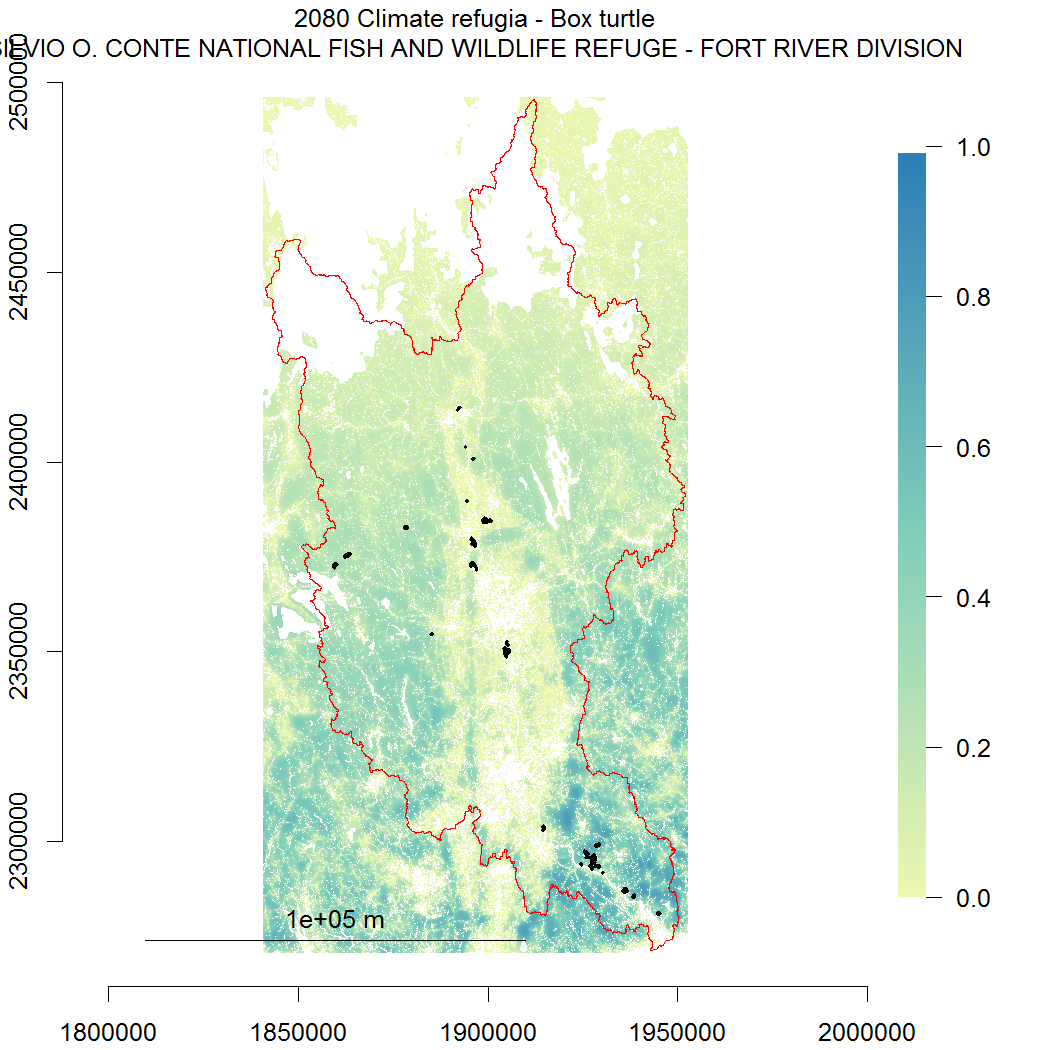
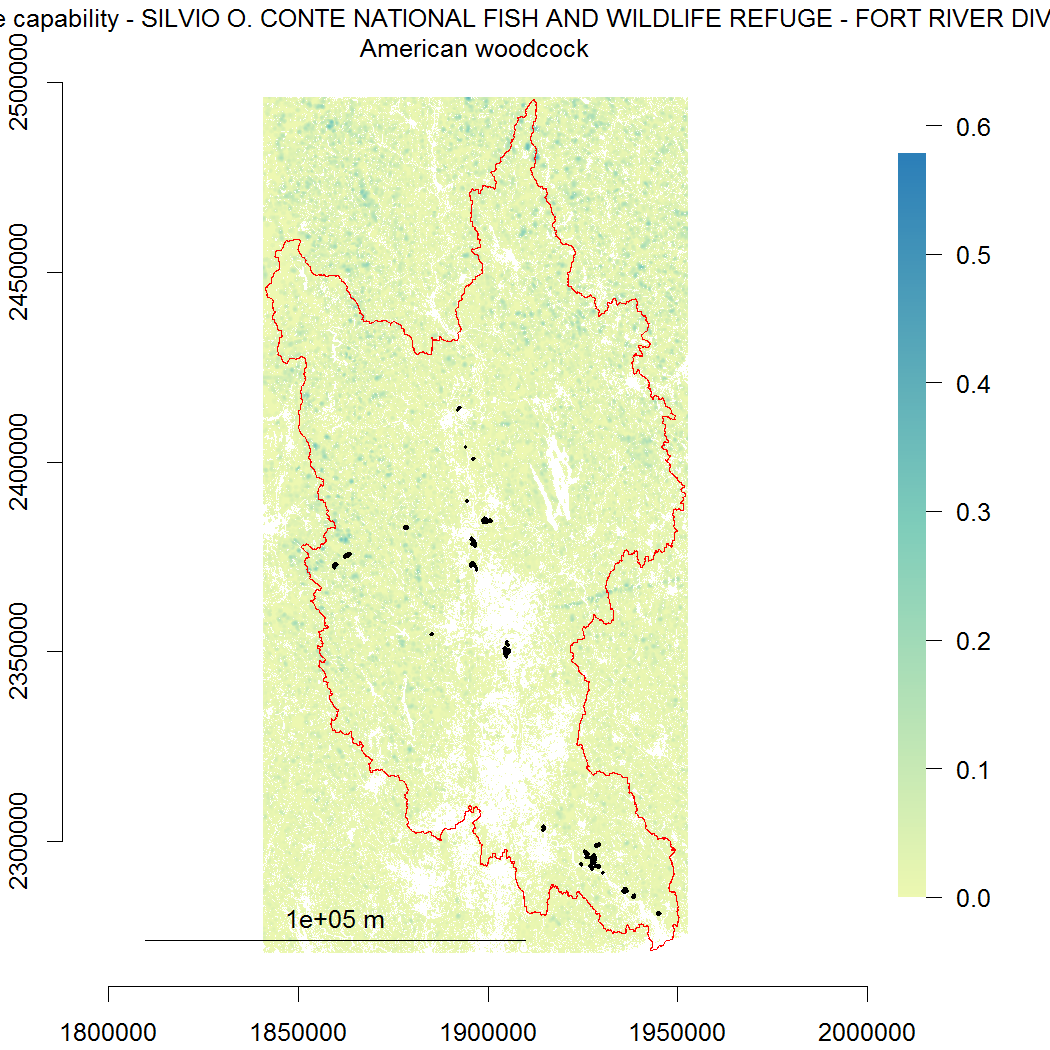
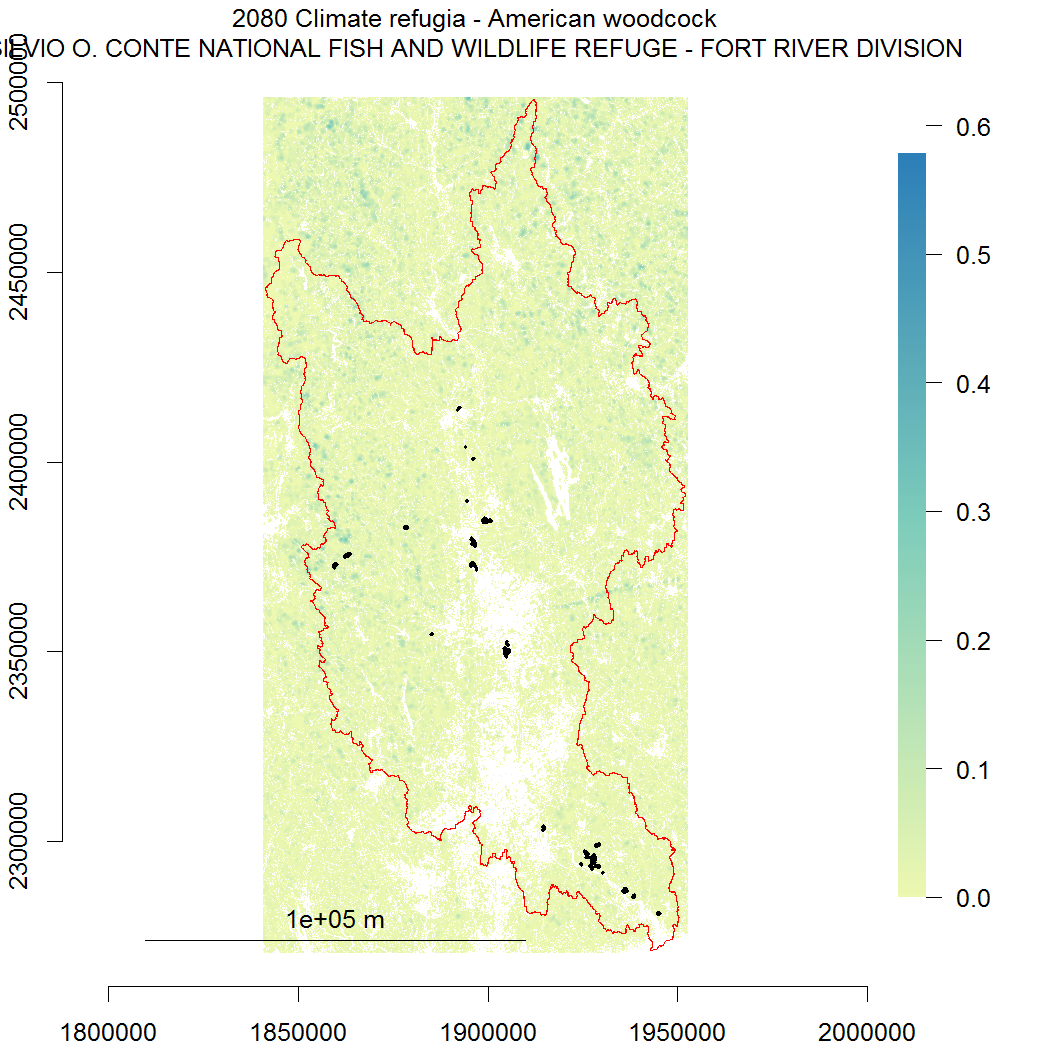
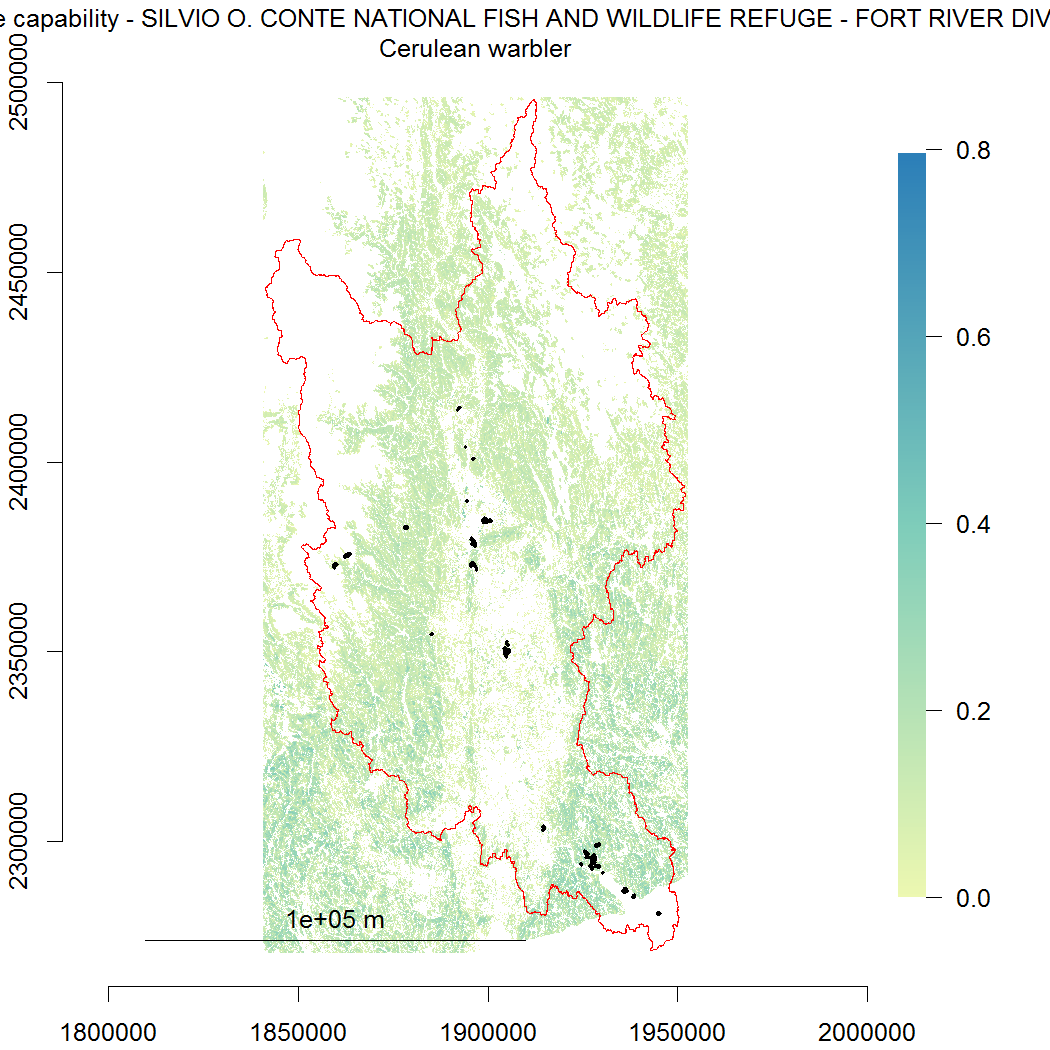
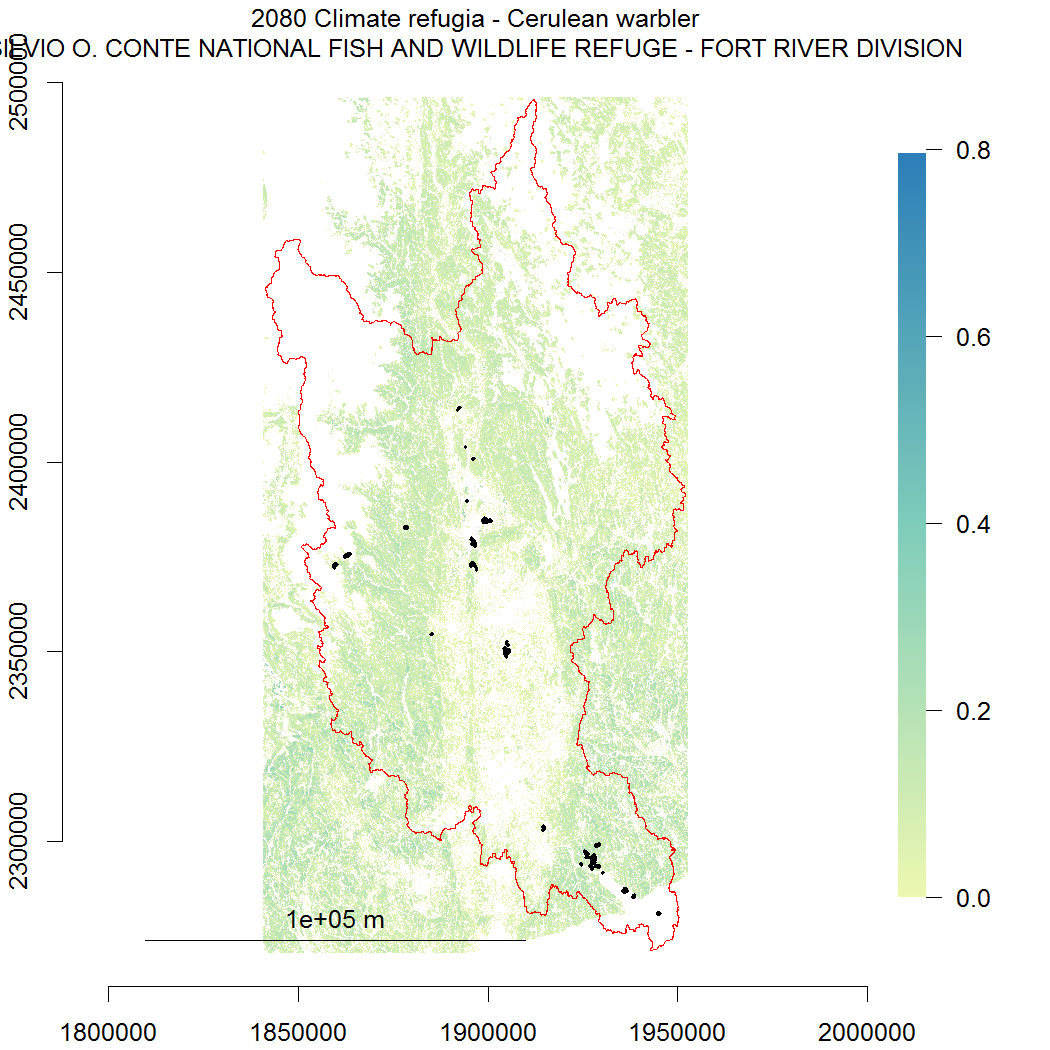
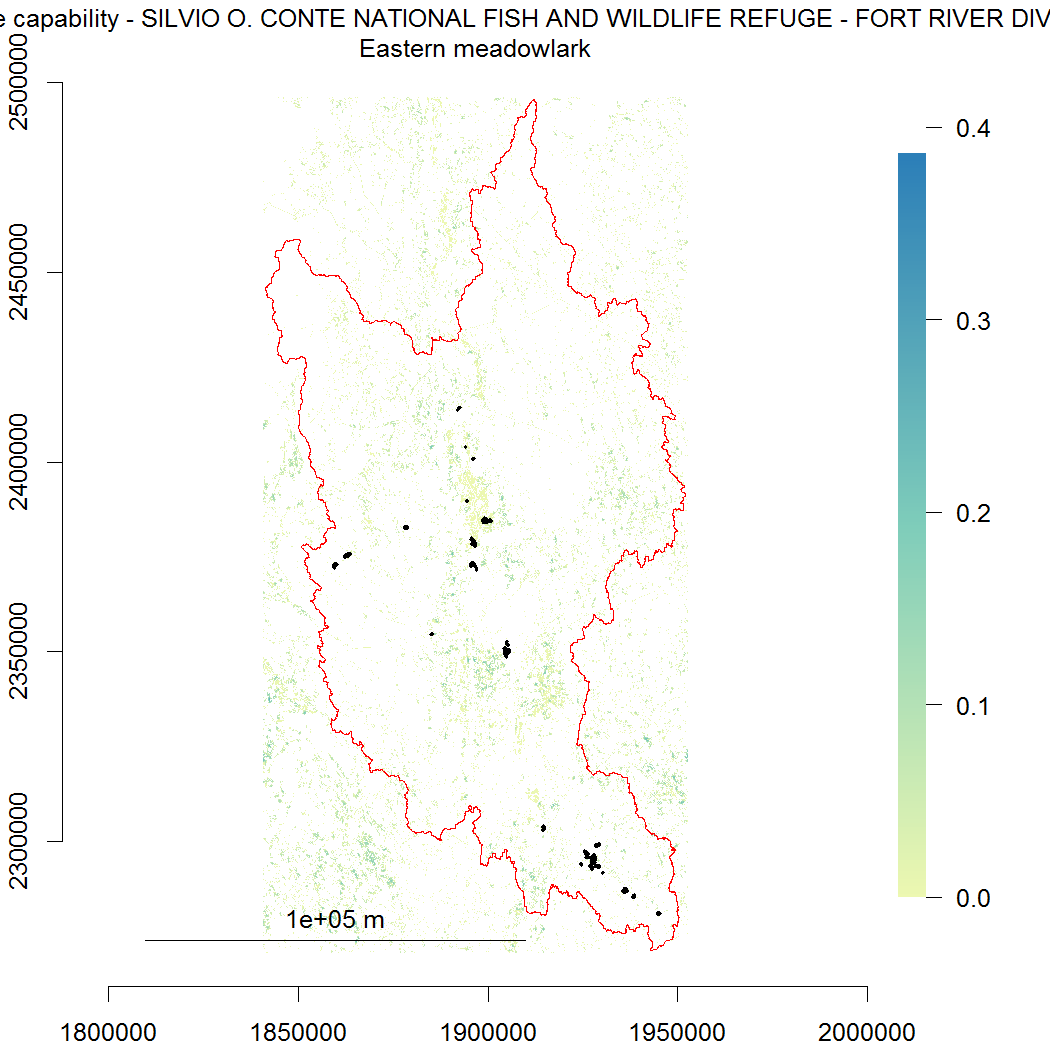
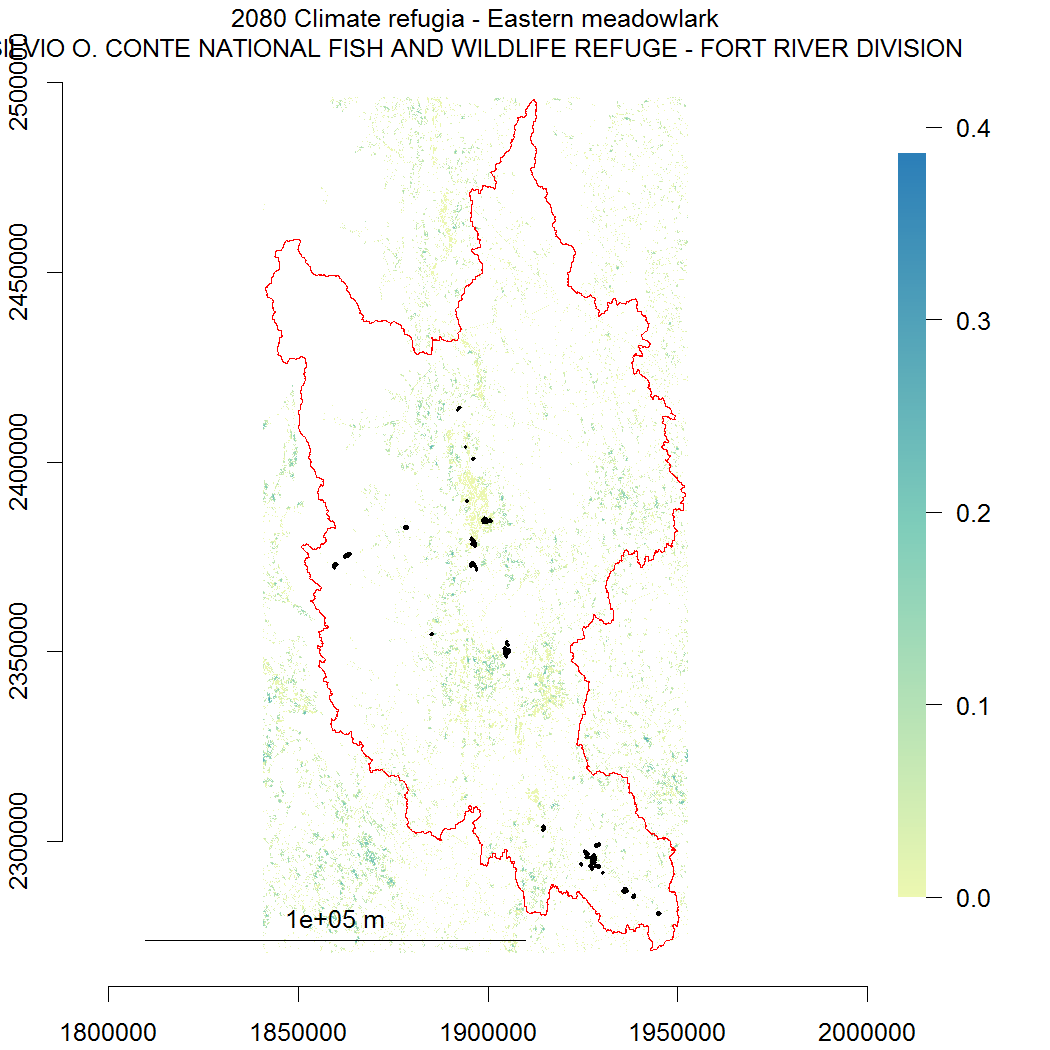
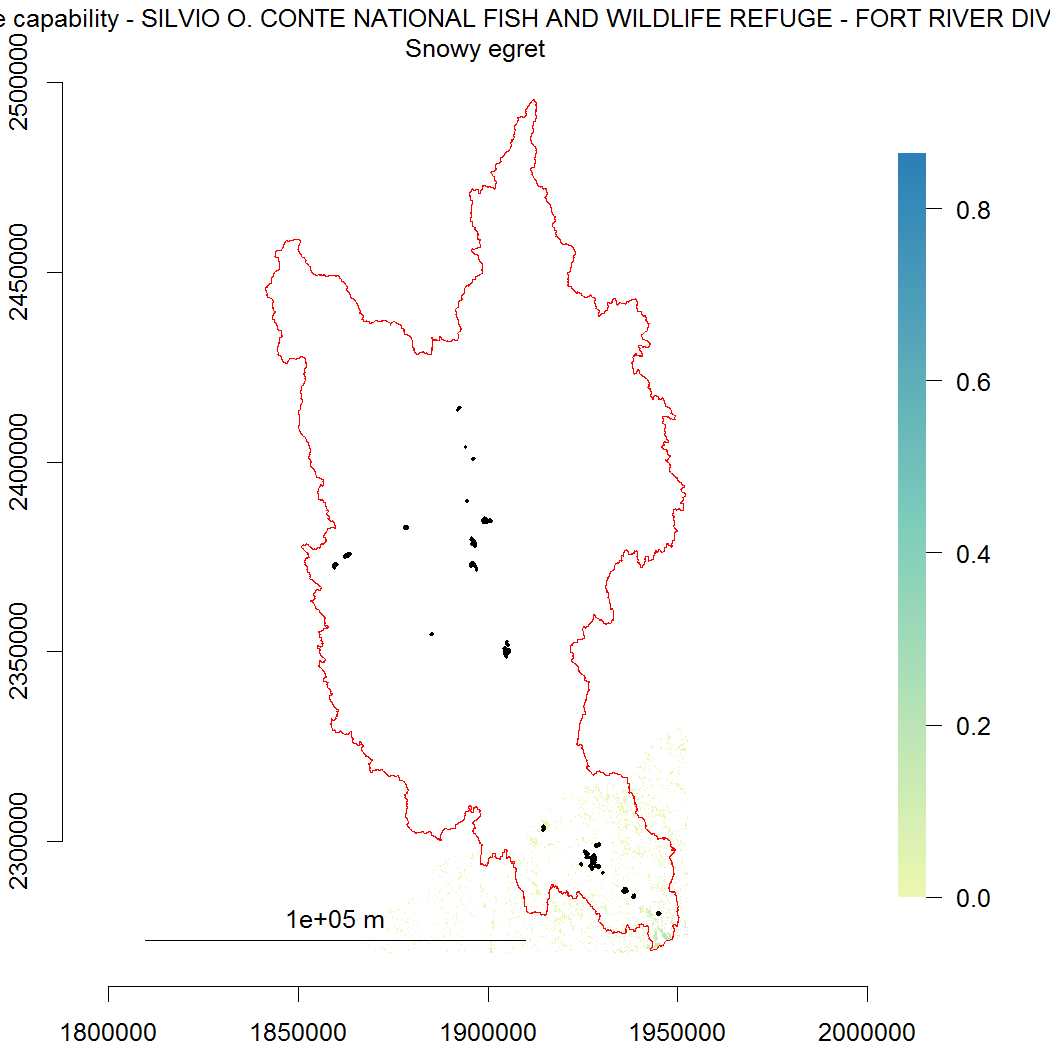
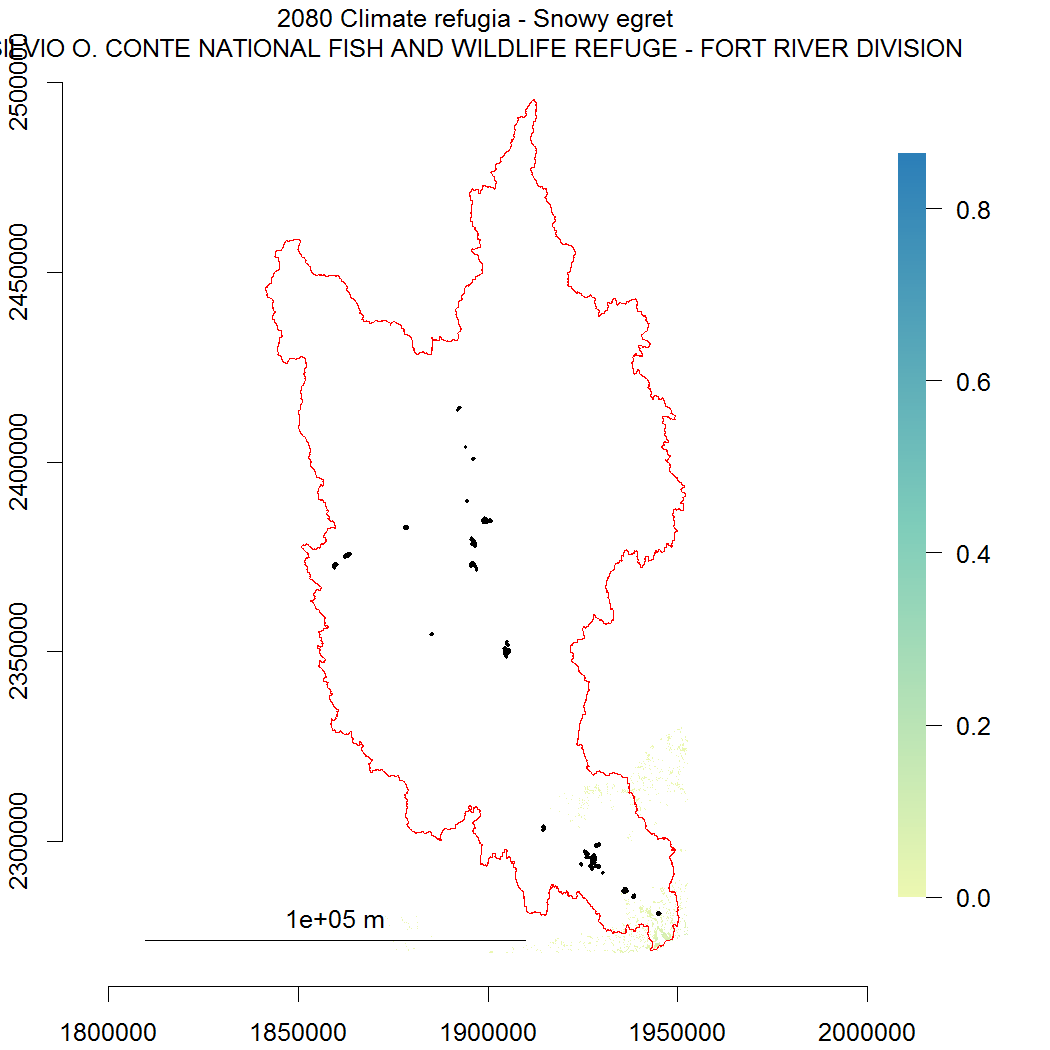
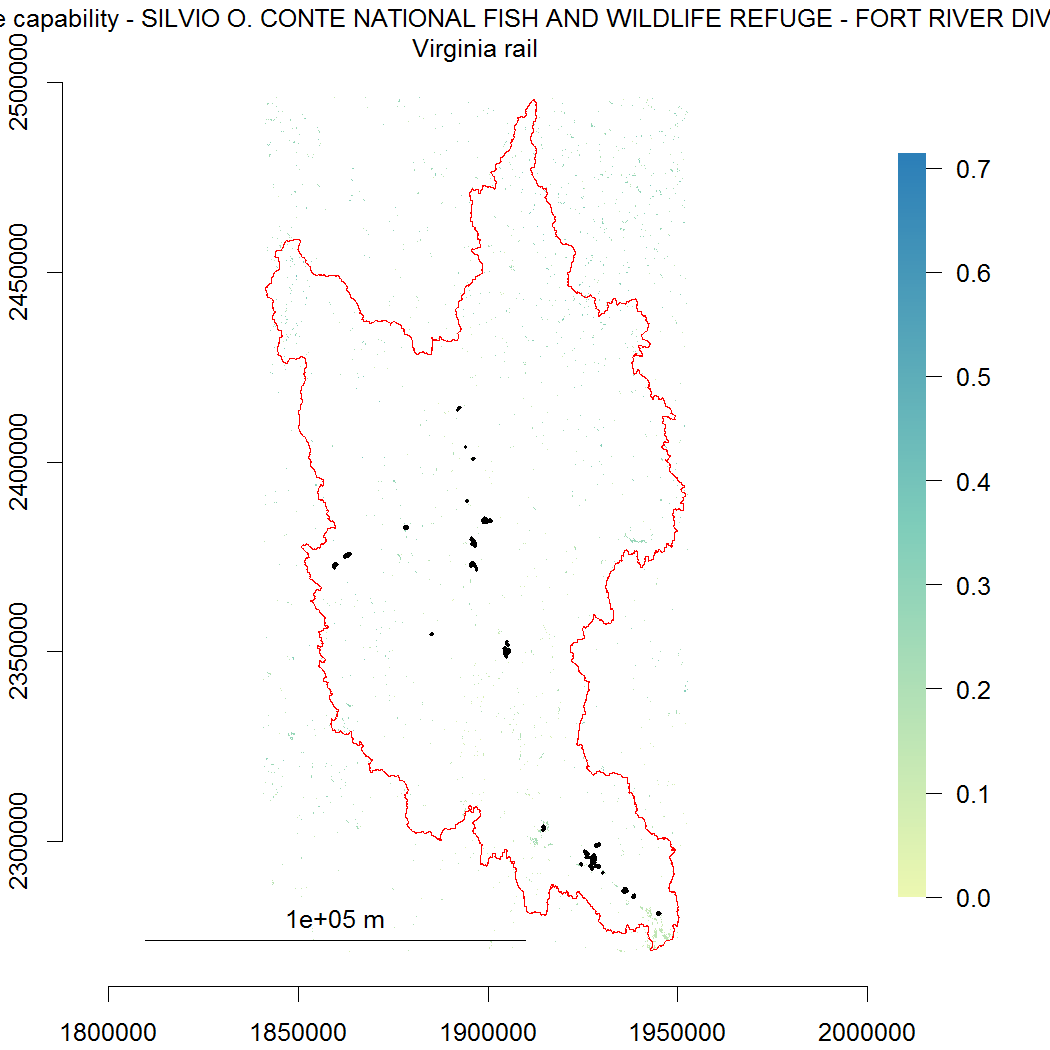
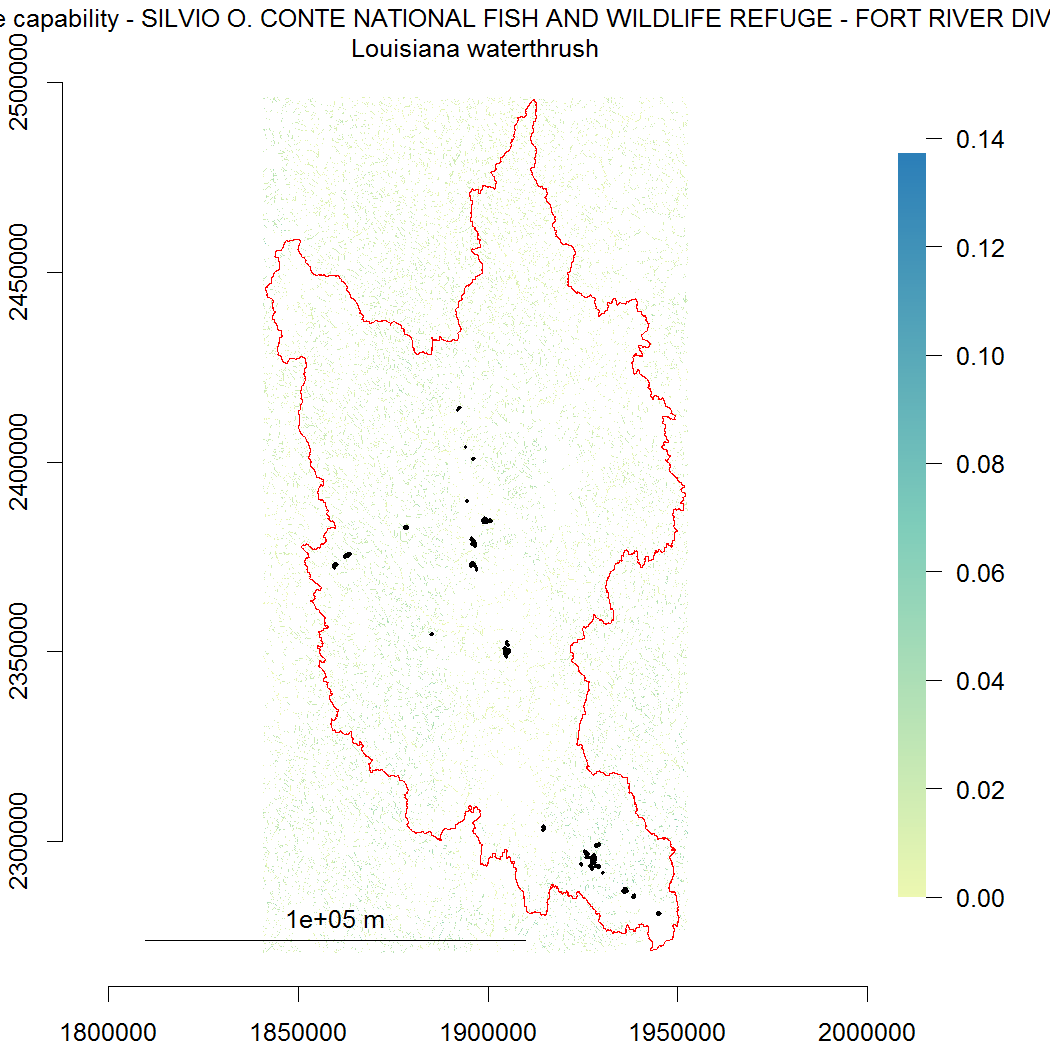
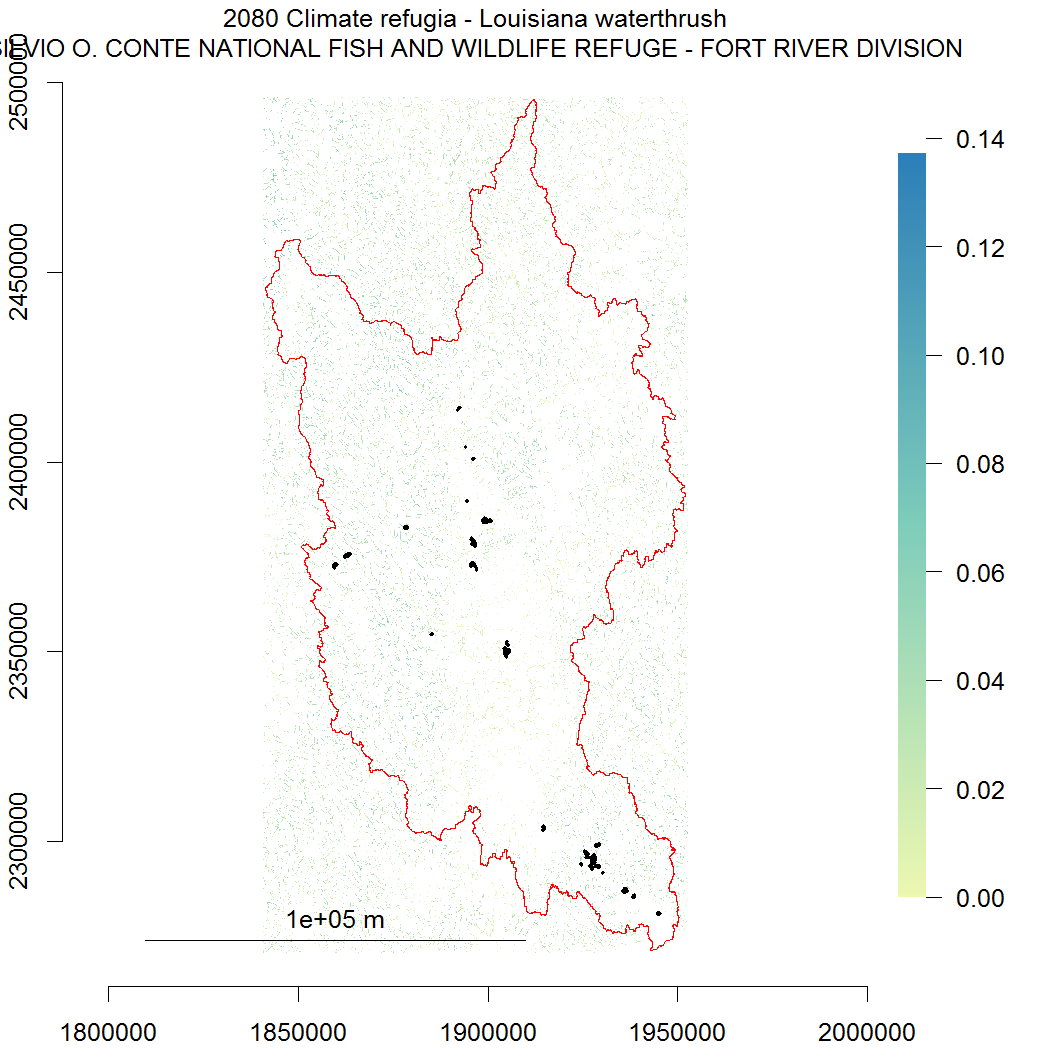
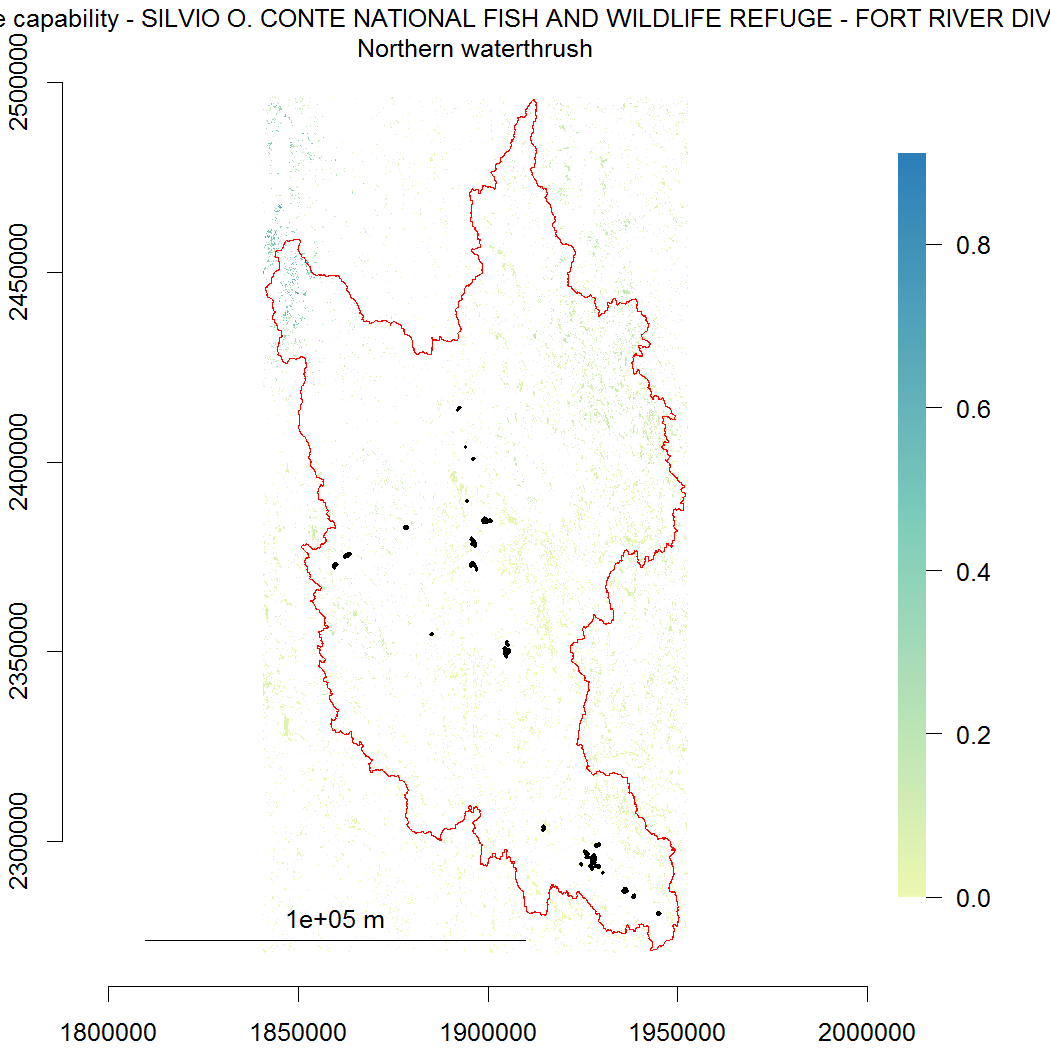
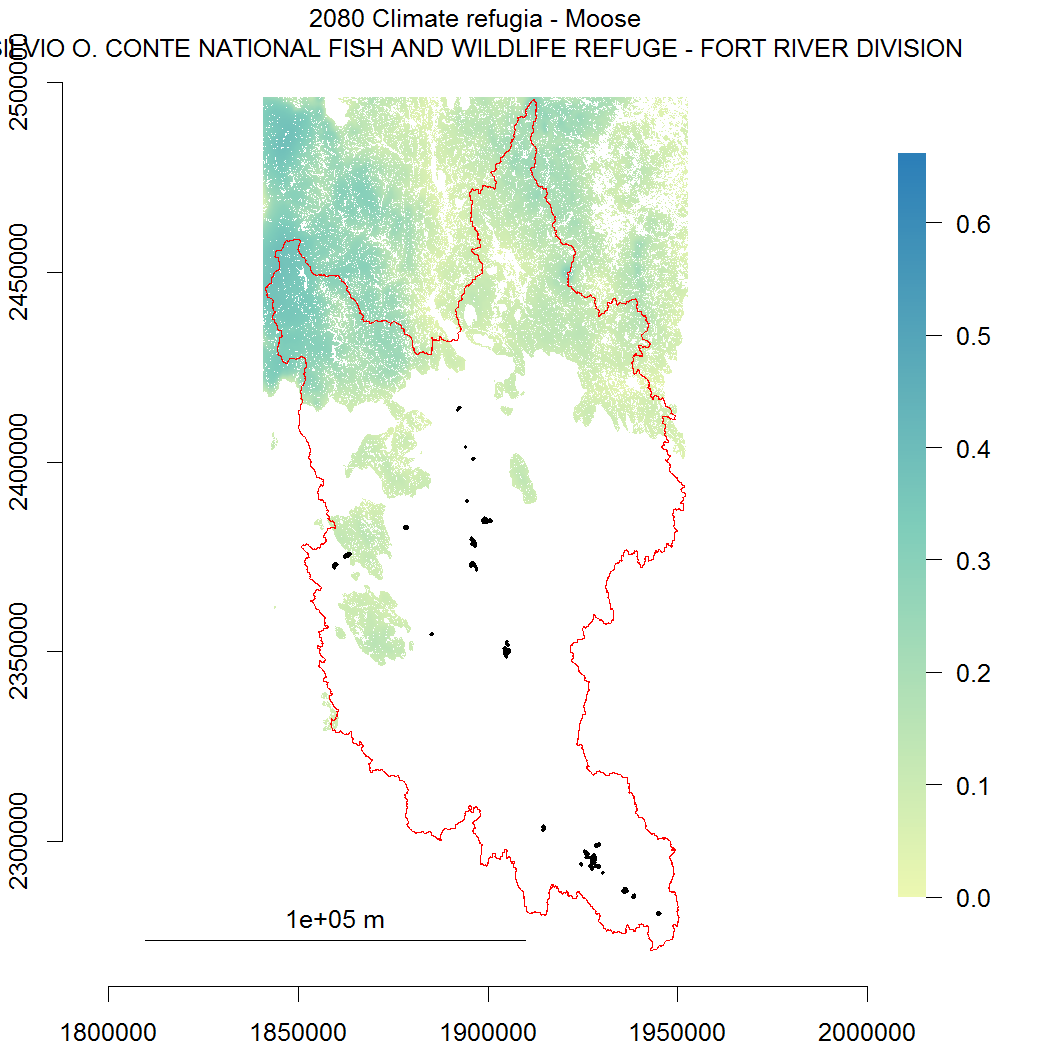
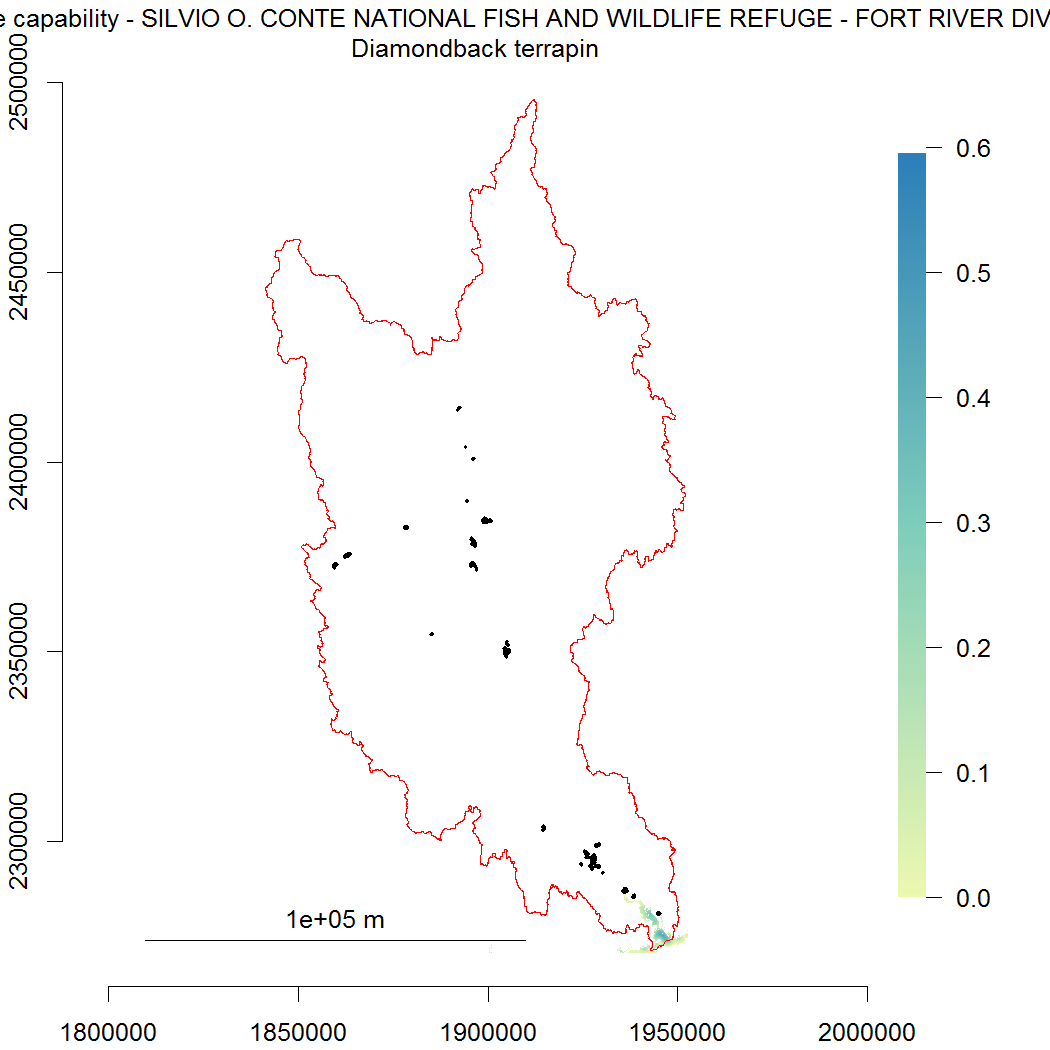
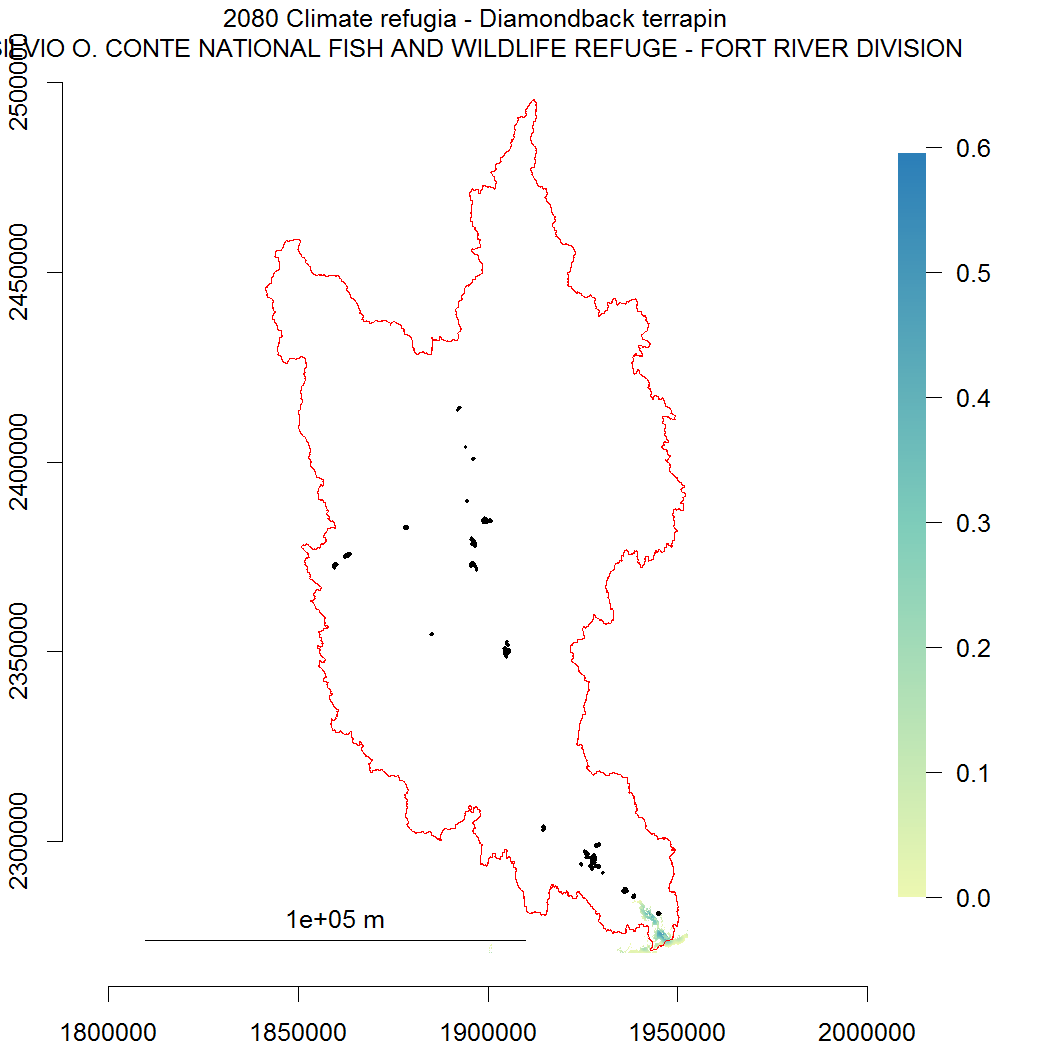
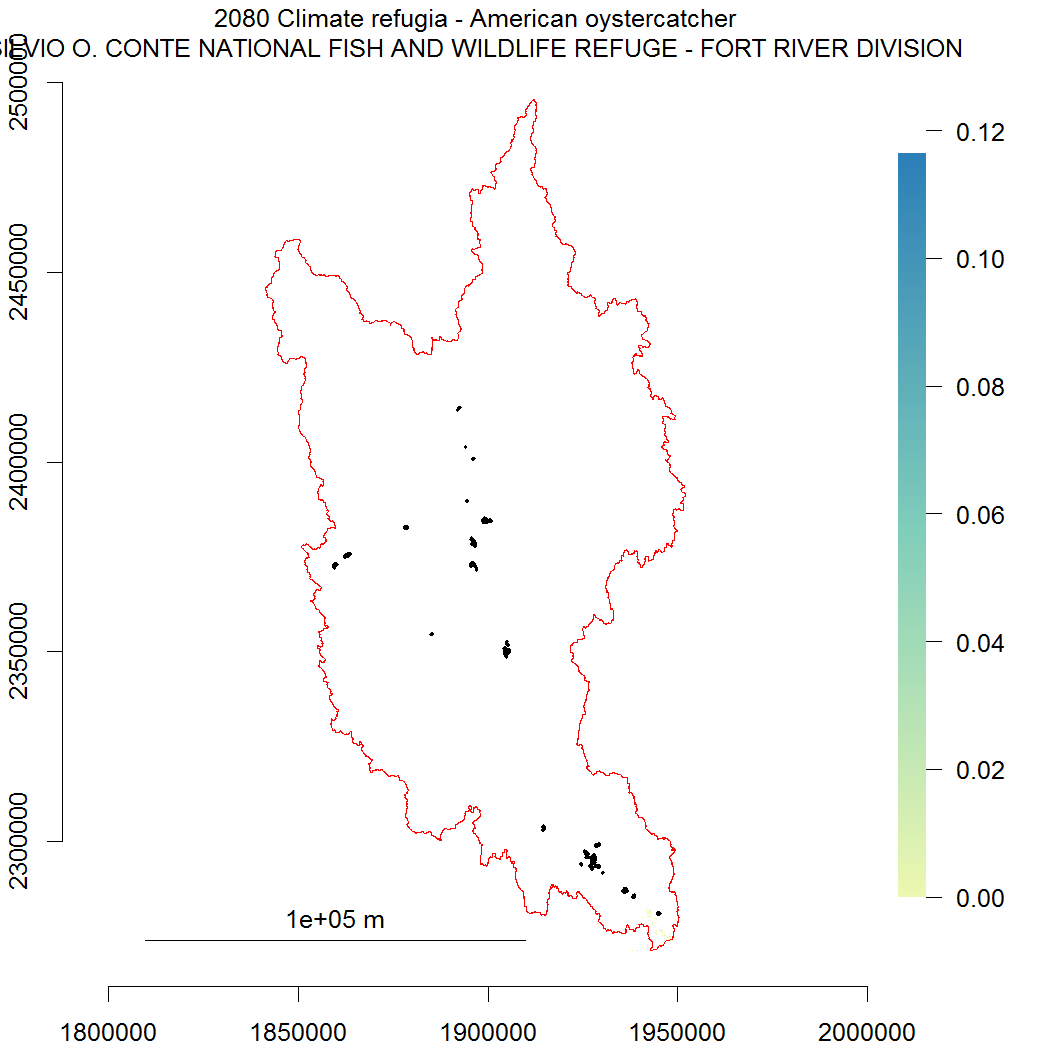
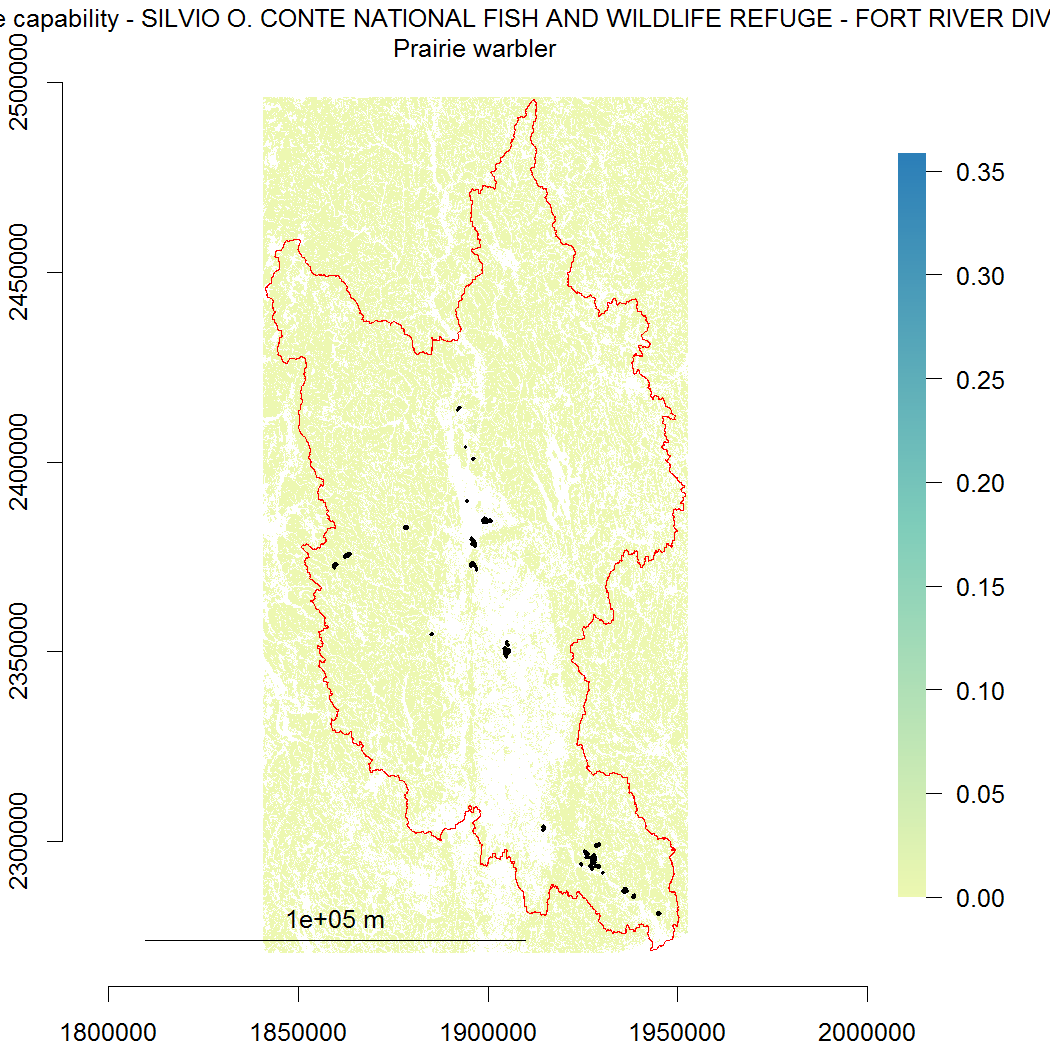
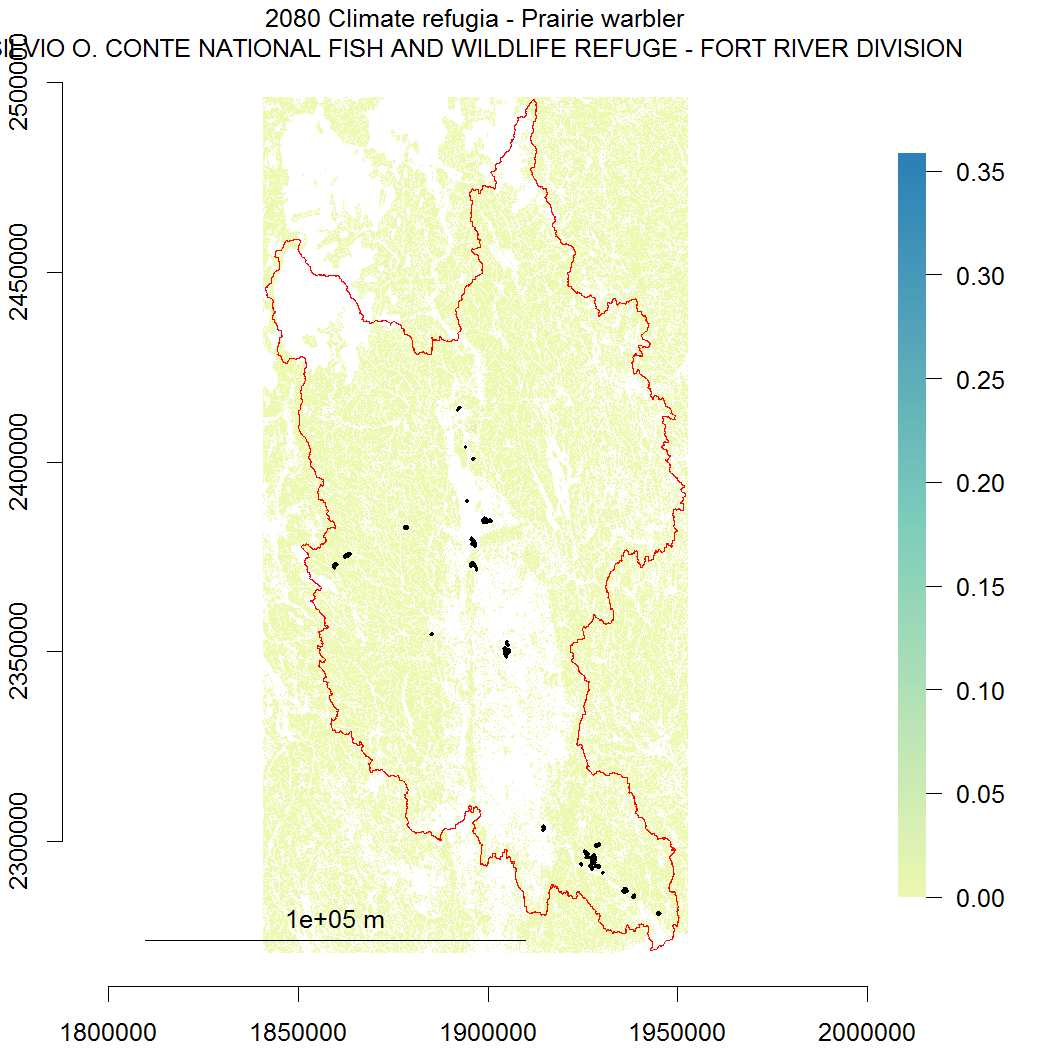
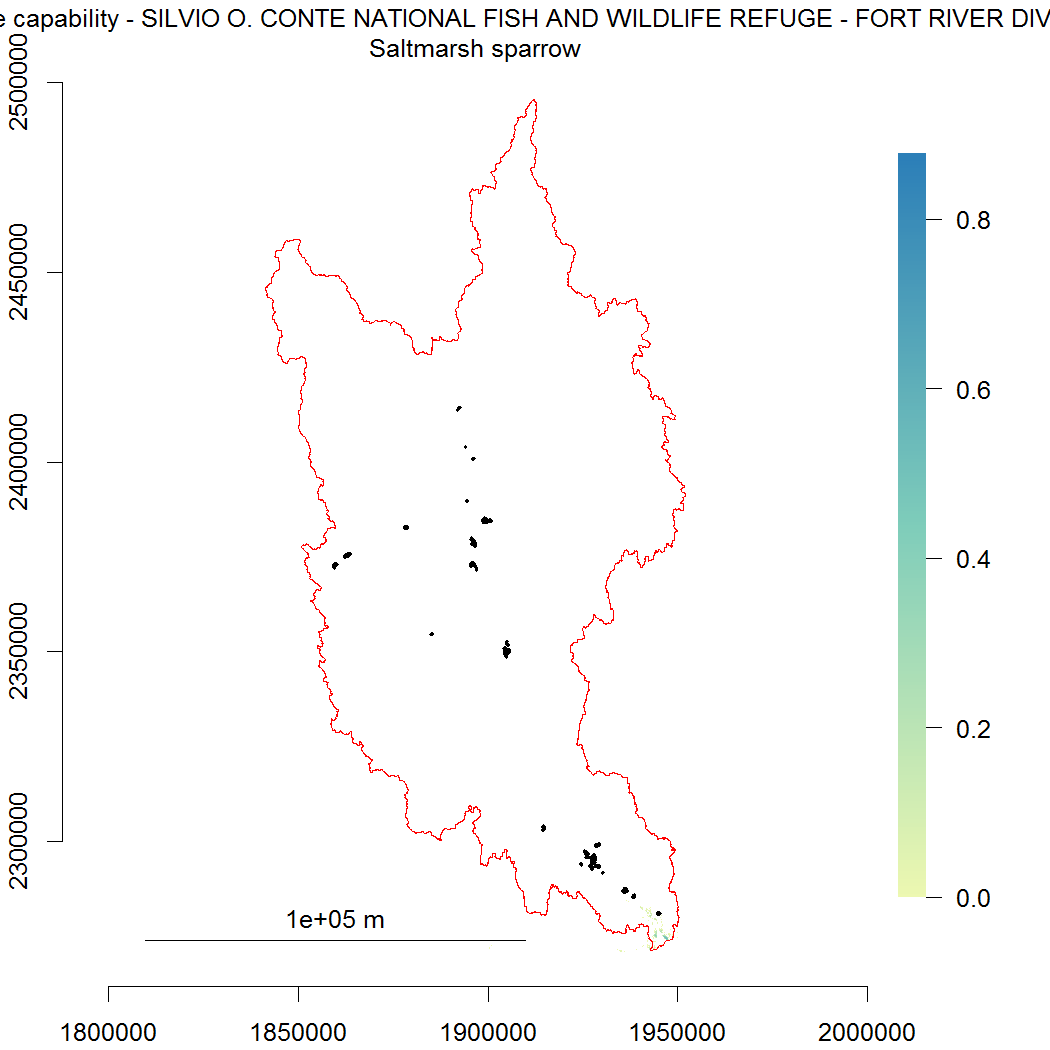
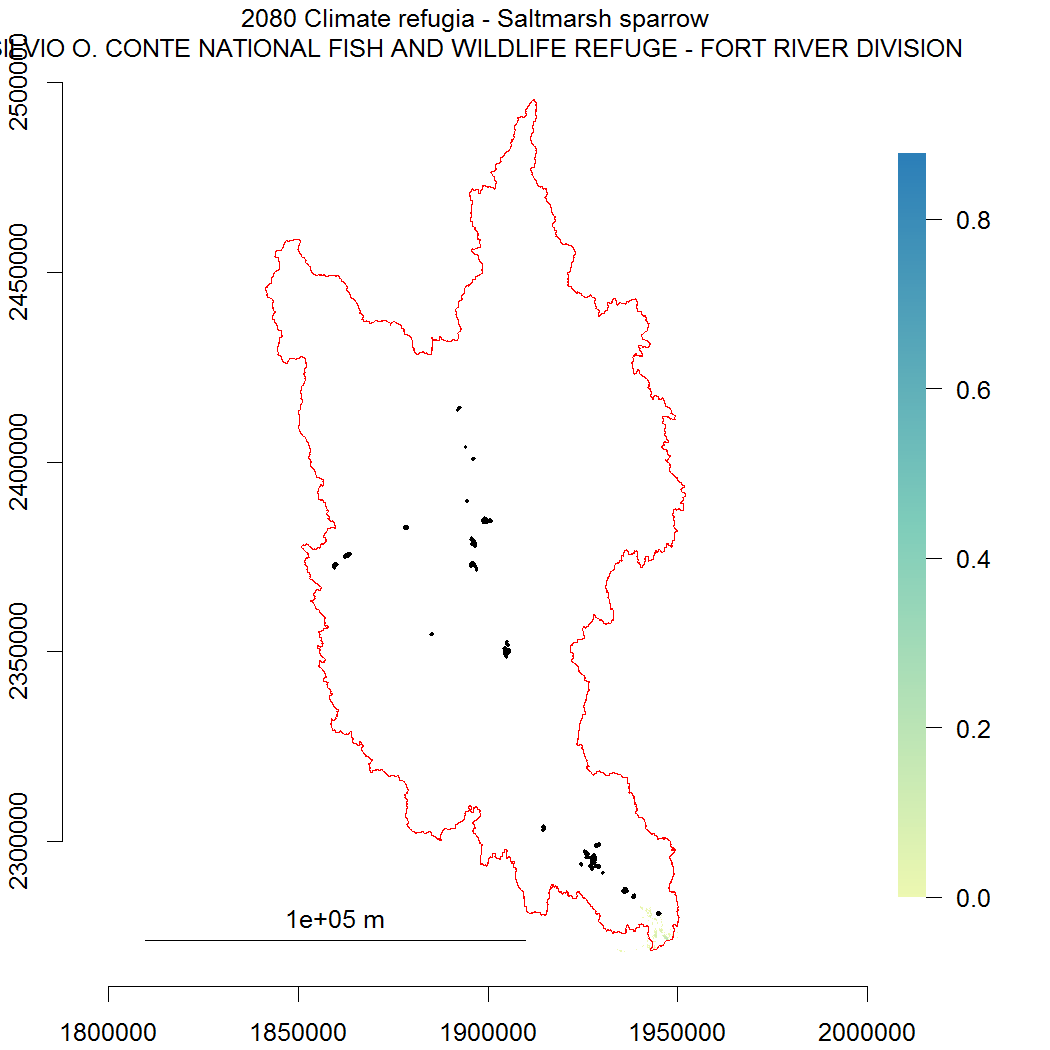
The metrics below indicate the ability of the refuge to support the species in the present based on Landscape Capability (LC total, LC density), and the presence of climate refugia for the species in 2080 (Refugia total, Refugia density). The total columns represent the ability of the refuge to support populations. The density columns represent how the mean LC or Refugia in the refuge compare to the mean value in the entire region. A detailed description of each column and the data sources are at the bottom.
The first table contains statistics for the refuge; if there is an Acquisition Zone (AZ) for the refuge a second table will contain statistics for it.
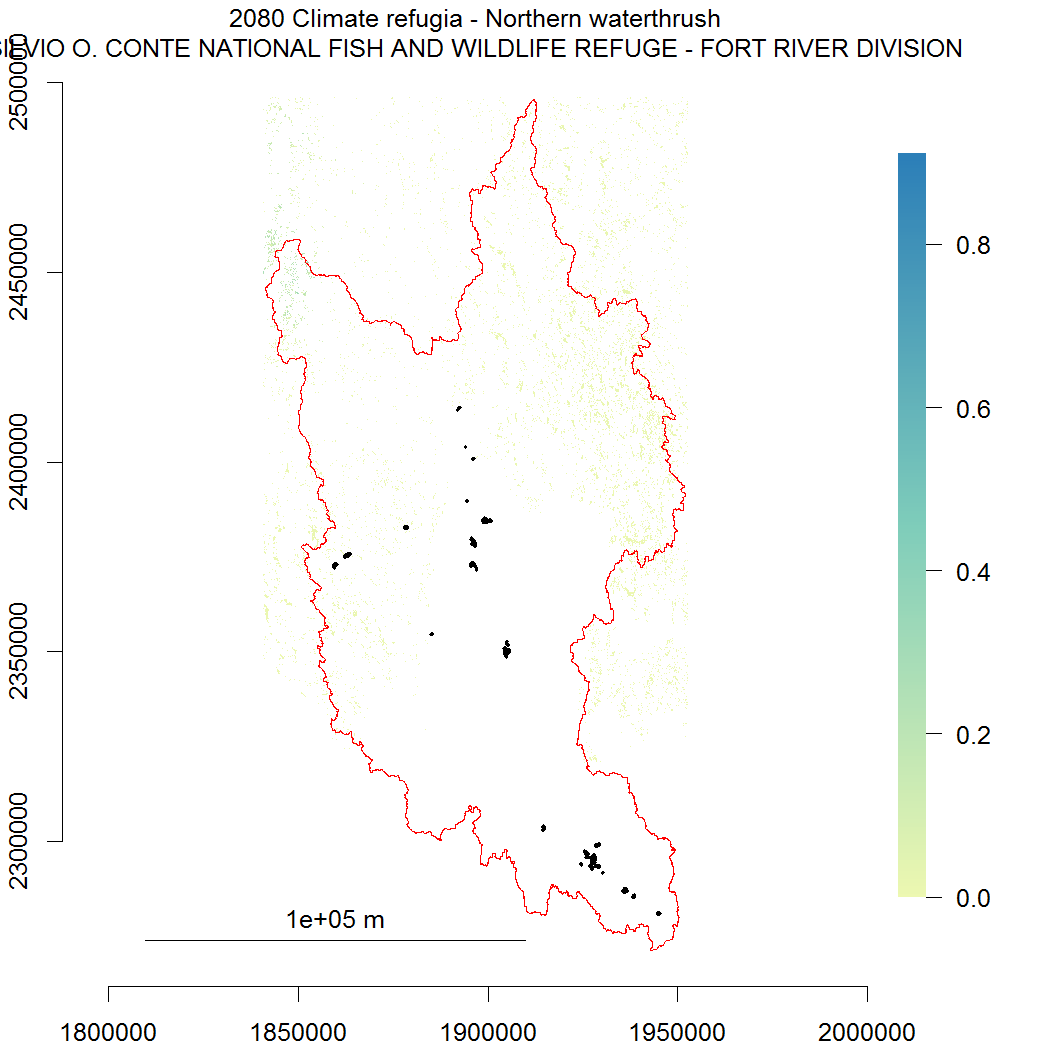
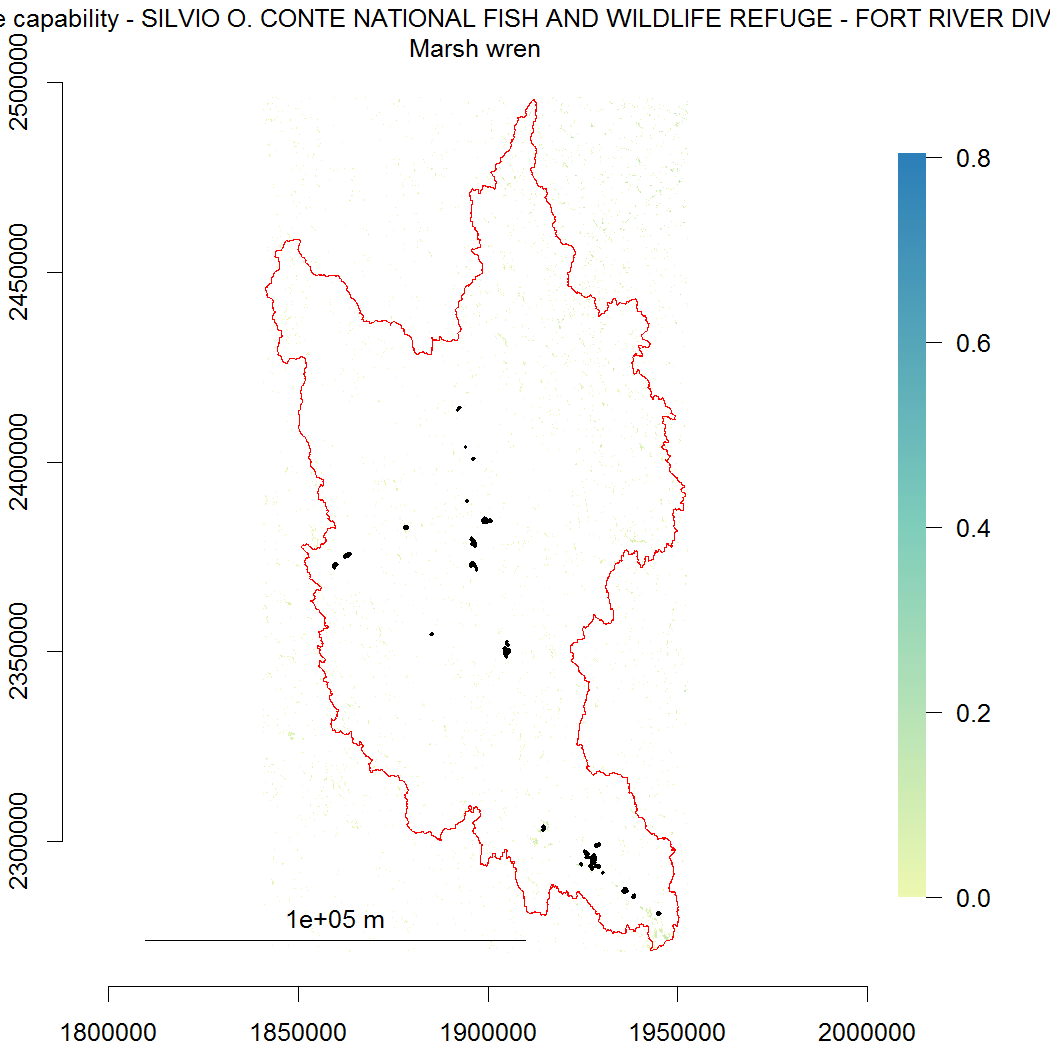
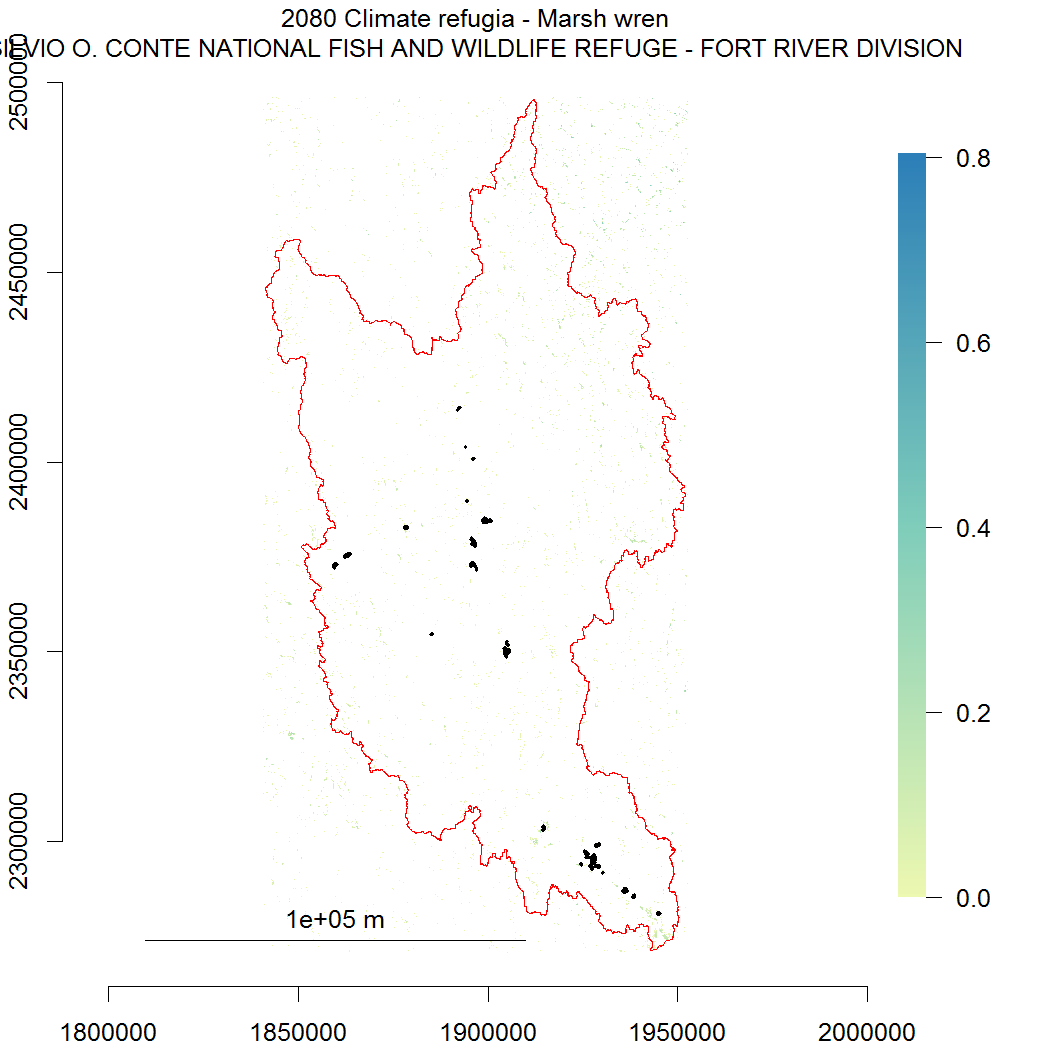
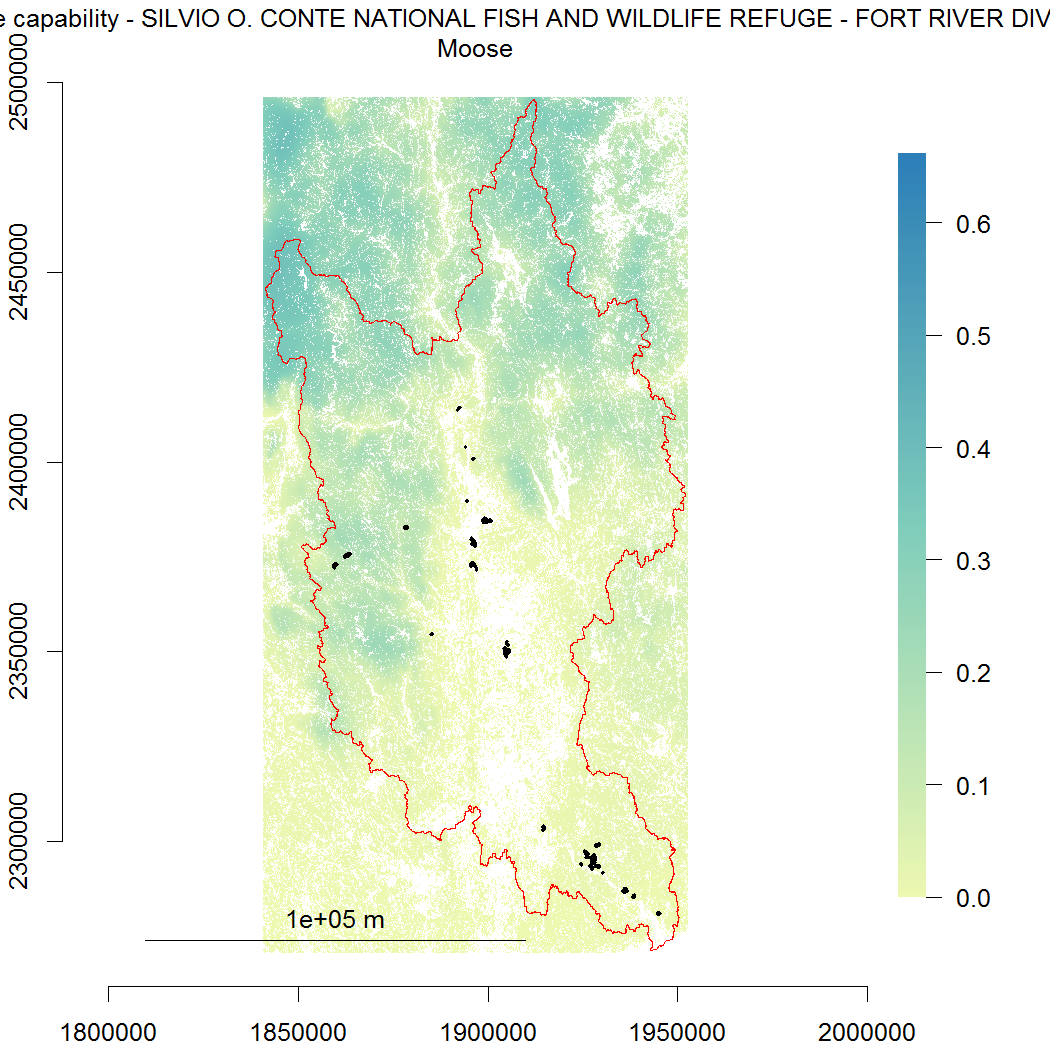
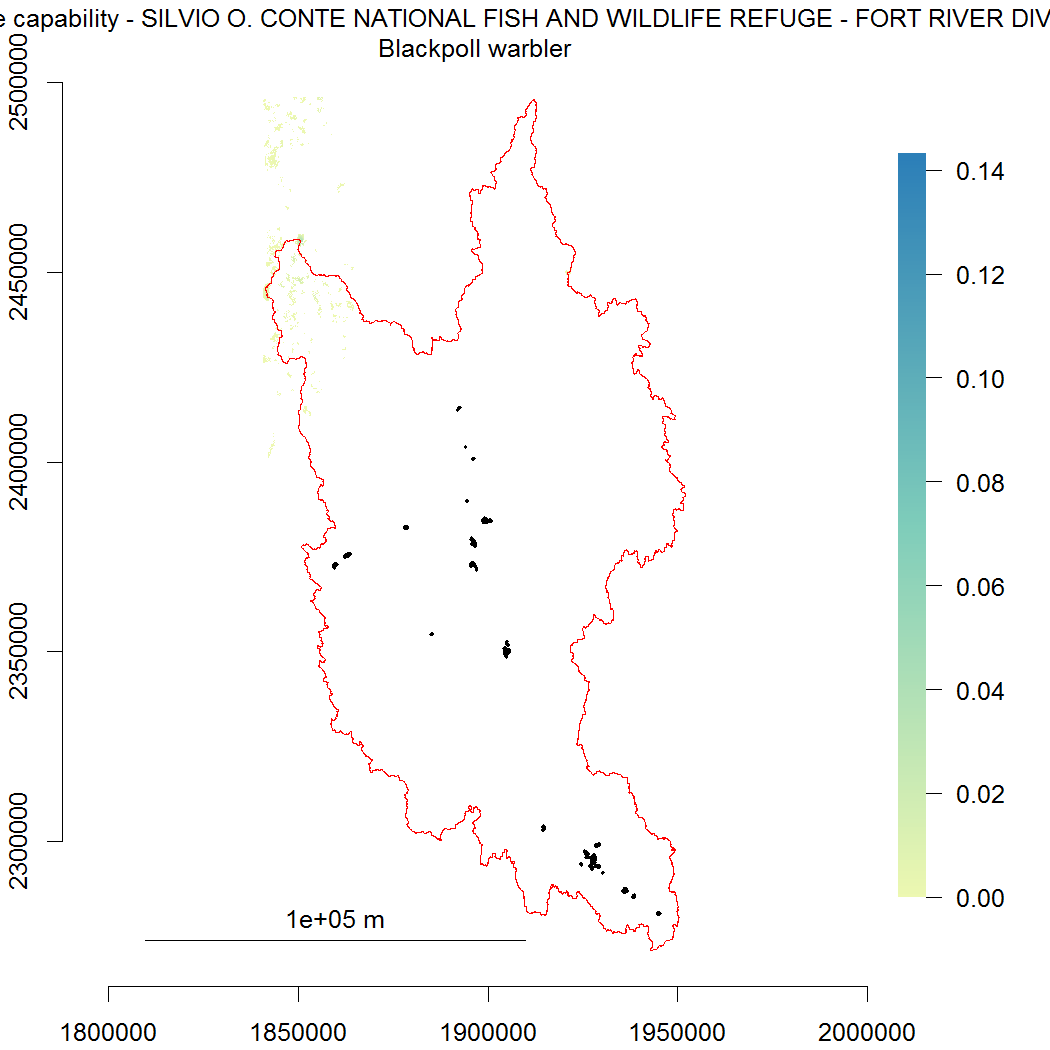
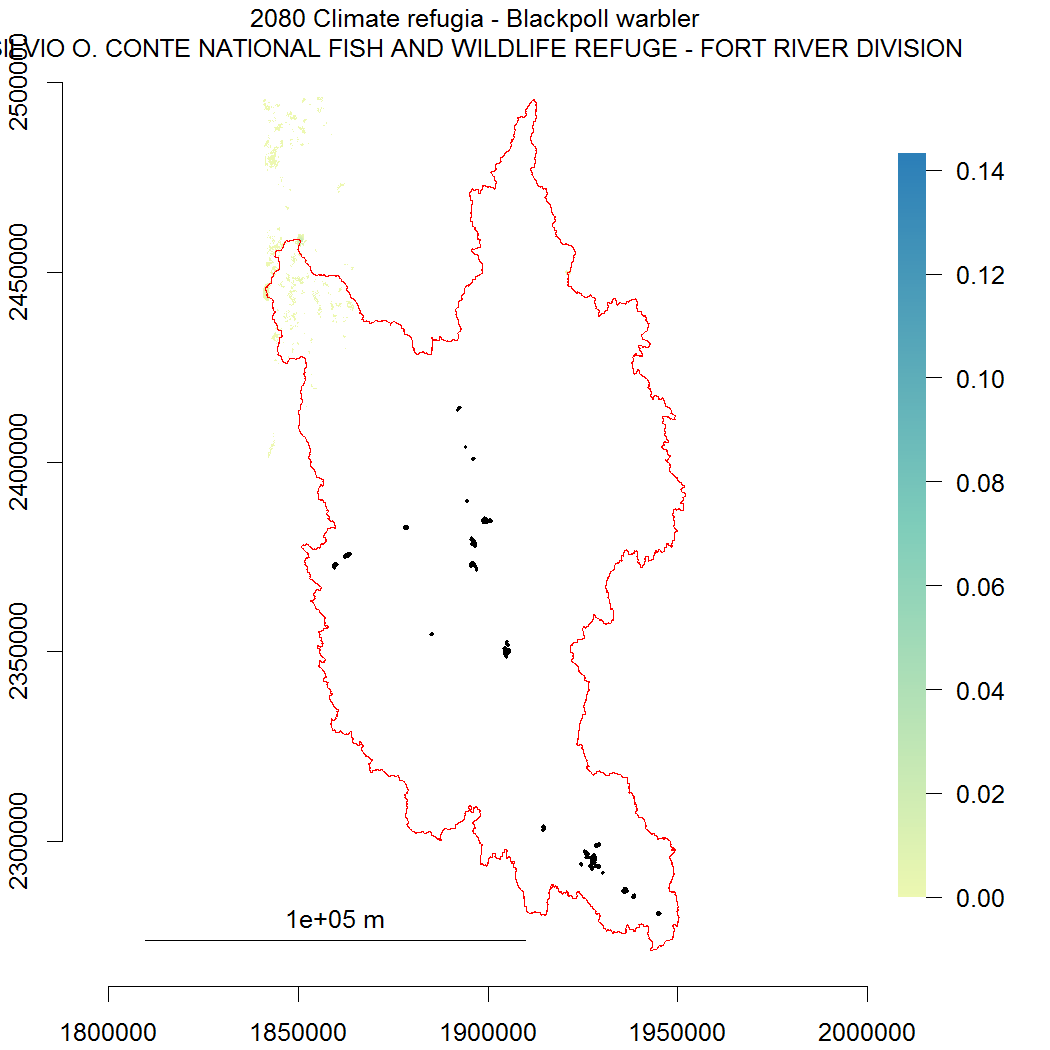
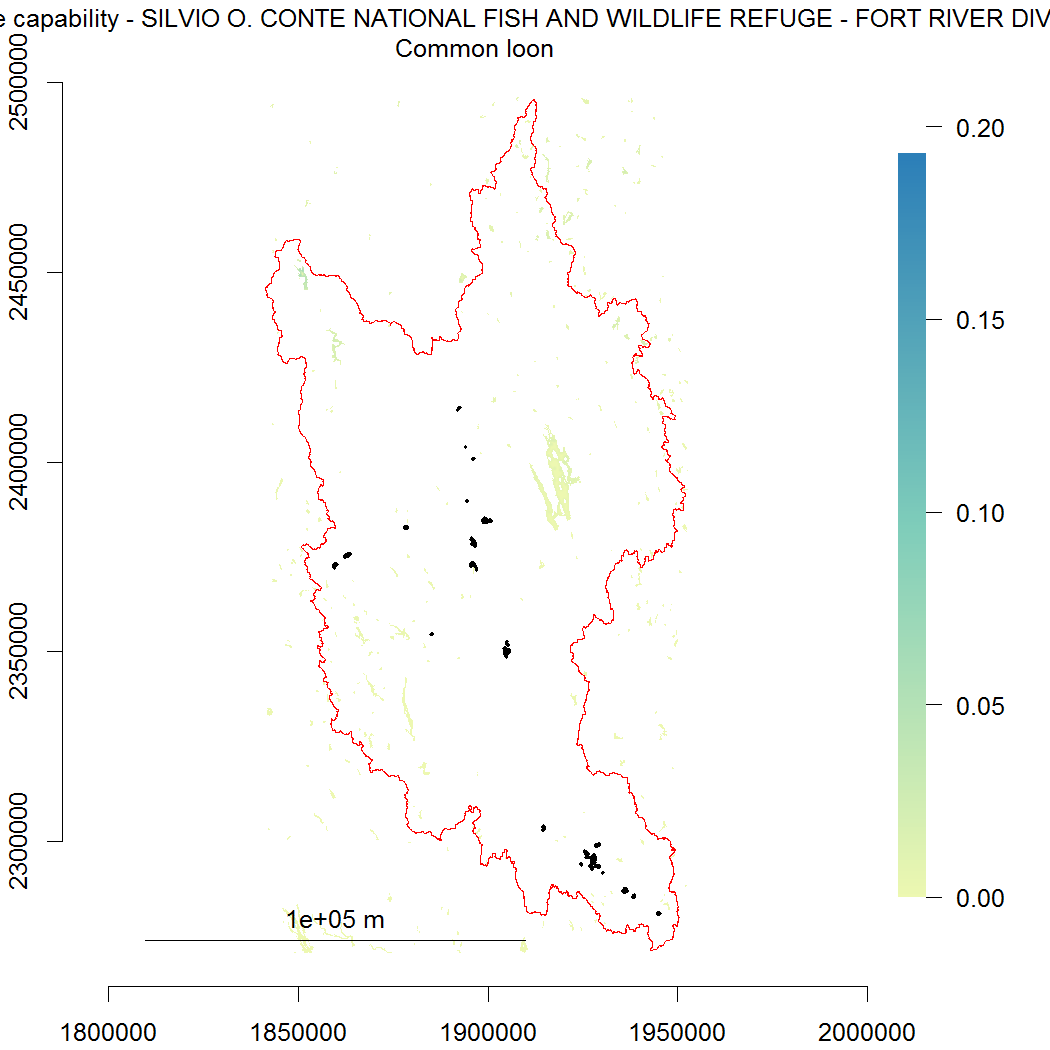
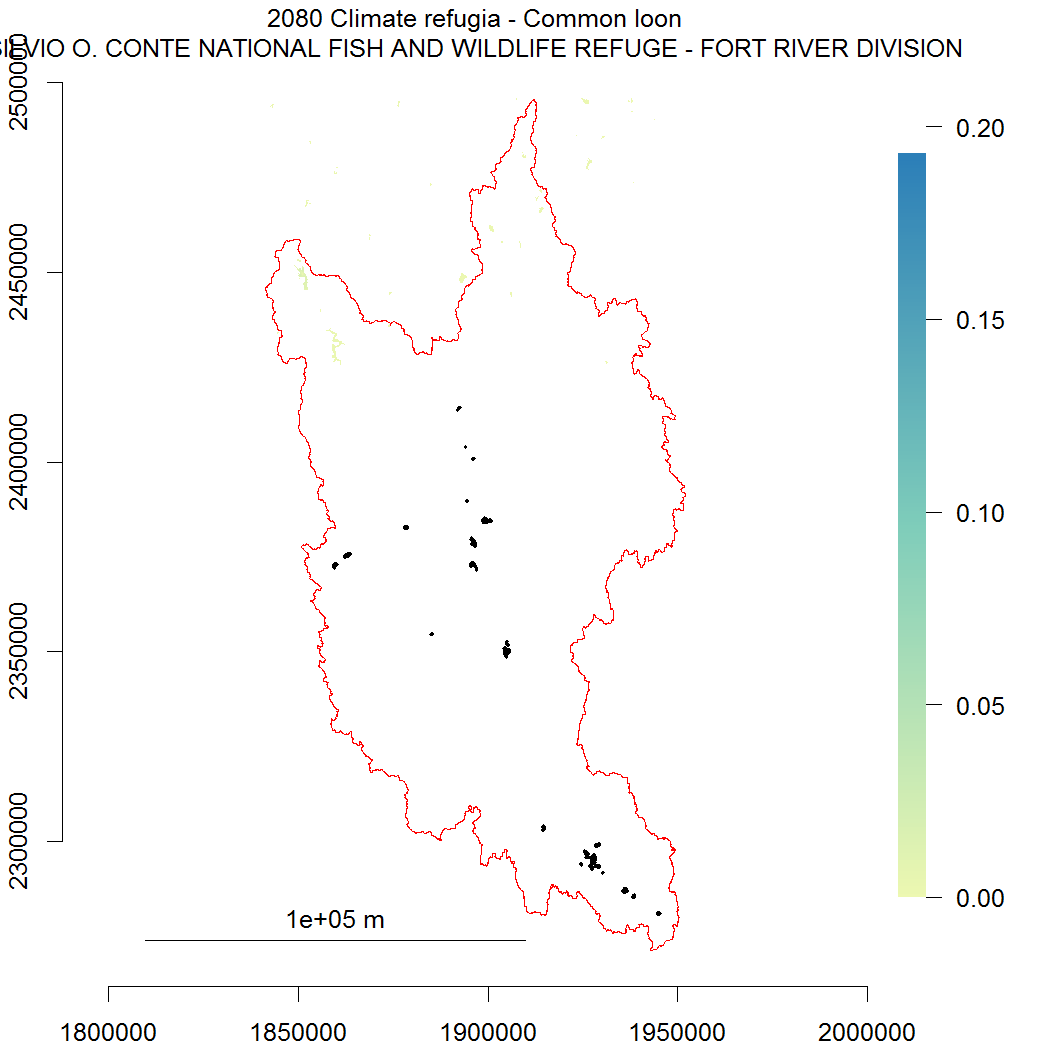
Links are embedded in the species names to the documentation for that species. Values in the metric columns link to maps of LC and 2080 Climate Refugia. Maps are only present if the maximum value for the species in the refuge exceeds 5% of the maximum value for the species in the region (for either LC, Refugia or both). In the maps the refuge boundary is marked with a black line and the acquisition zone boundary with a red line. Maps are not provided for sensitive species (Wood turtle, Piping plover).
Refuge statistics
Acquisition zone statistics
Interpretation of data
Species This is the species model that statistics on the row apply to. They are ordered by decreasing Landscape Capability (LC) density. Each species is a link to the documentation for that species.
LC total is the sum of LC across the refuge, in hectares, giving an index of the ability of the refuge to support populations of the species in the present. For example, if 10 hectares in the refuge have a LC value of 0.5, the LC total would be 5.0. Since this metric is a sum of the refuge’s ability to support the species, larger refuges have an inherent advantage.
Refugia total is calculated in the same manner as LC total, but for the 2080 climate refugia. Higher values for a refuge indicate an ability to support larger populations of the species in the future. Since this metric is a sum of the refuge’s ability to support the species, larger refuges have an inherent advantage.
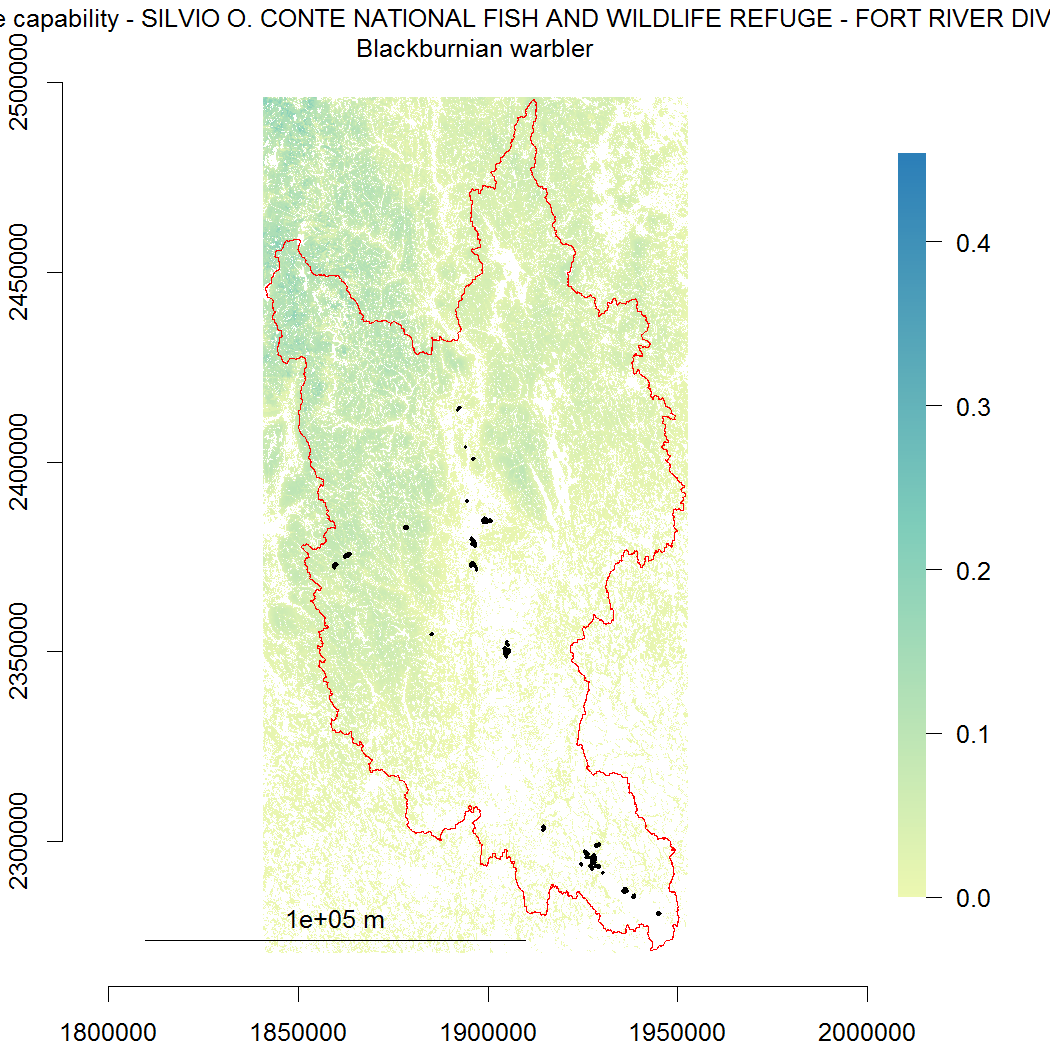
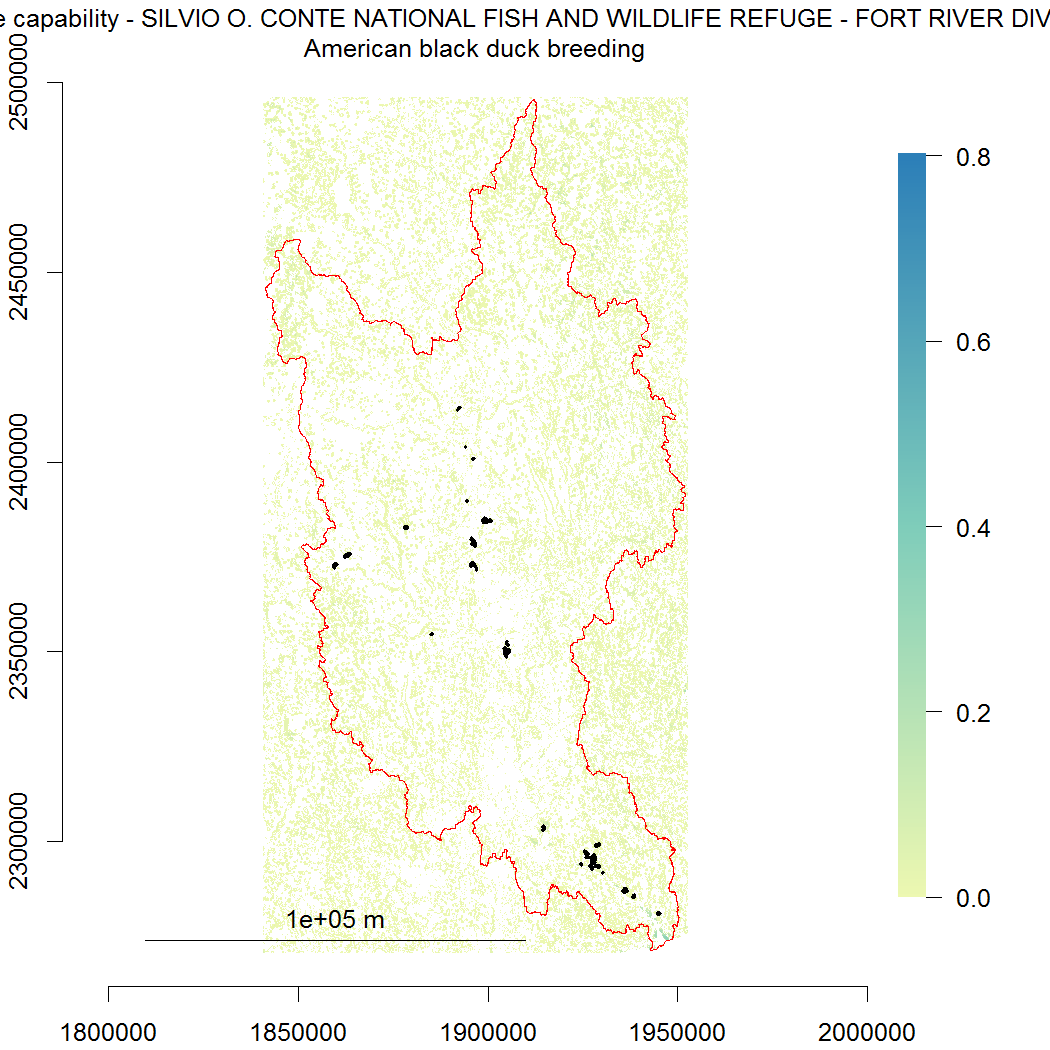
LC density reflects the density of LC for a species in a given refuge. Density is the average LC for the species in the refuge dived by the average LC value for that species in the region as a whole. A value of 1 indicates that the refuge has (on average) the average value for the region. Higher values indicate greater concentration of the species within the refuge; a density of 5 for instance would mean that the refuge has 5 times the region average LC for the species. Since it is a relative density this statistic really reflects the quality of the refuge independent of its size. The number is a link to a map of the 2010 LC in the refuge (black line) and AZ (red line).
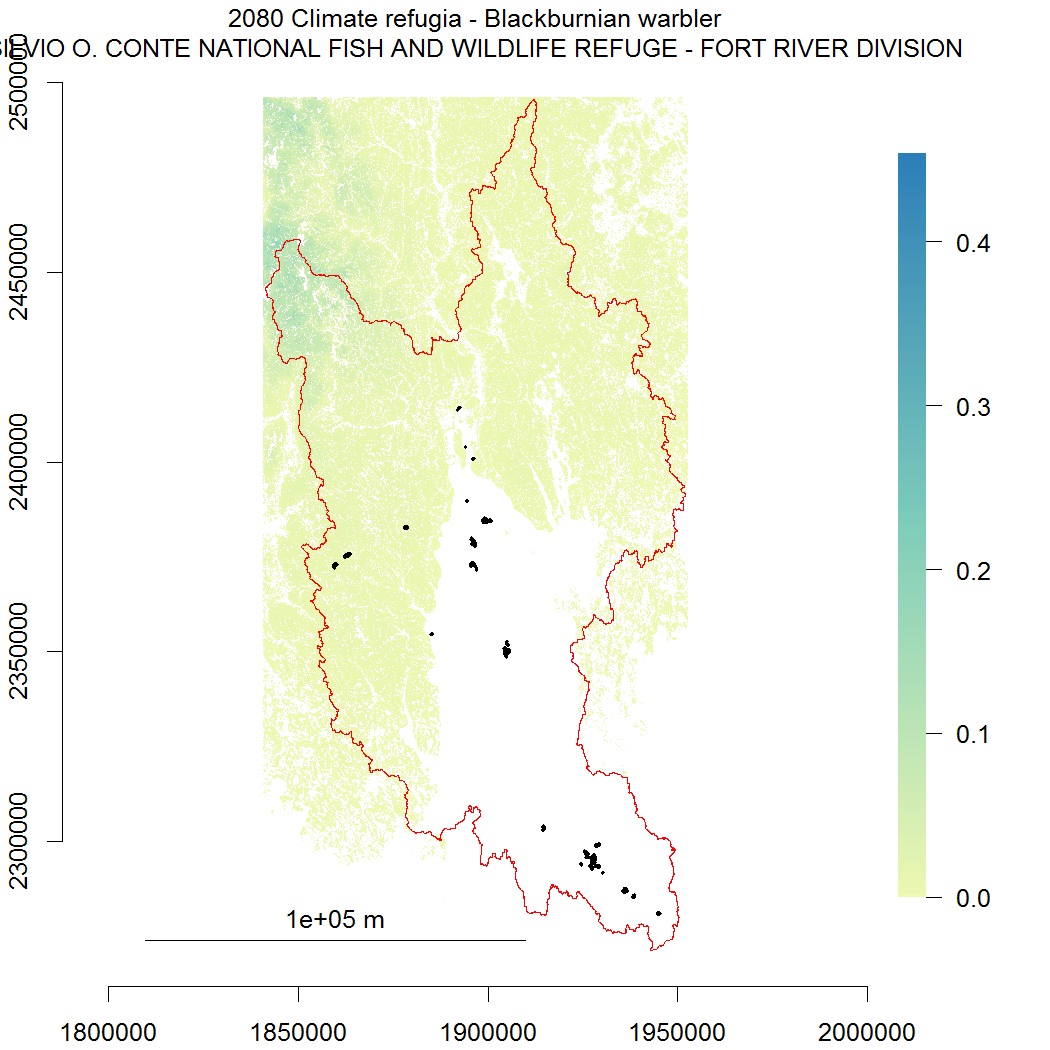
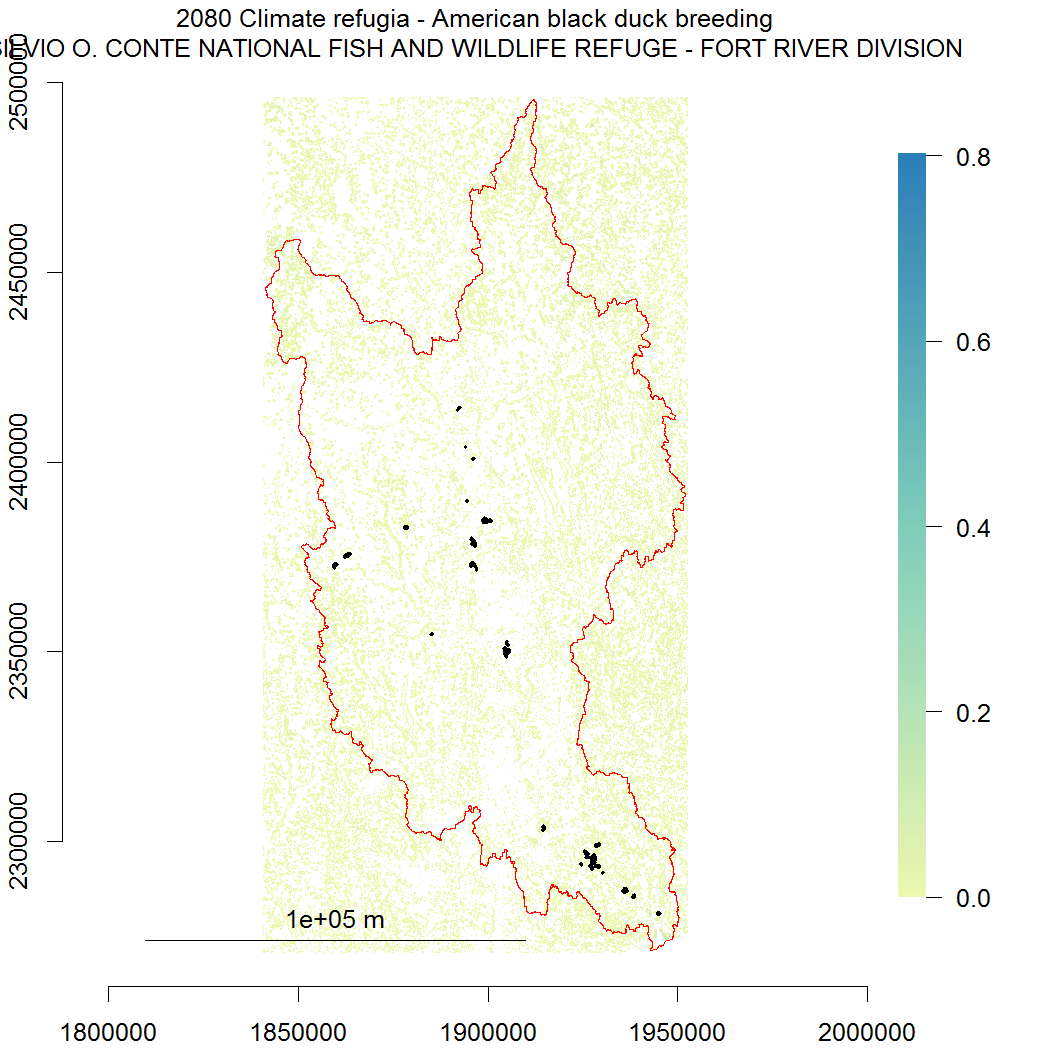
Refugia density is calculated in the same manner as the LC density but from 2080 climate refugia. Higher values indicate greater concentration of refugia within the refuge in the future. The underlying link leads to a map of the 2080 Climate Refugia for the species in the refuge (black line) and AZ (red line).
Data source
These statistics are based on Designing Sustainable Landscapes (DSL) models of 2010 Landscape Capability (LC) and 2080 Climate Refugia. Both of these datasets are indices of the ability of the landscape and climate to support populations of the species. They have a theoretical range from 0 to 1 but in practice the maximum values are usually below 1. Both LC and Climate Refugia are based on 2010 landcover but differ in the climate suitability; in LC the climate suitability is derived from 2010 climate variables while climate refugia is based on 2080 climate, while limiting the extent of the species to areas where the climate was suitable in 2010. For a full description of the species modeling process see the documentation. The underlying GIS data is available at http://umassdsl.org - use the version 3 species data links.